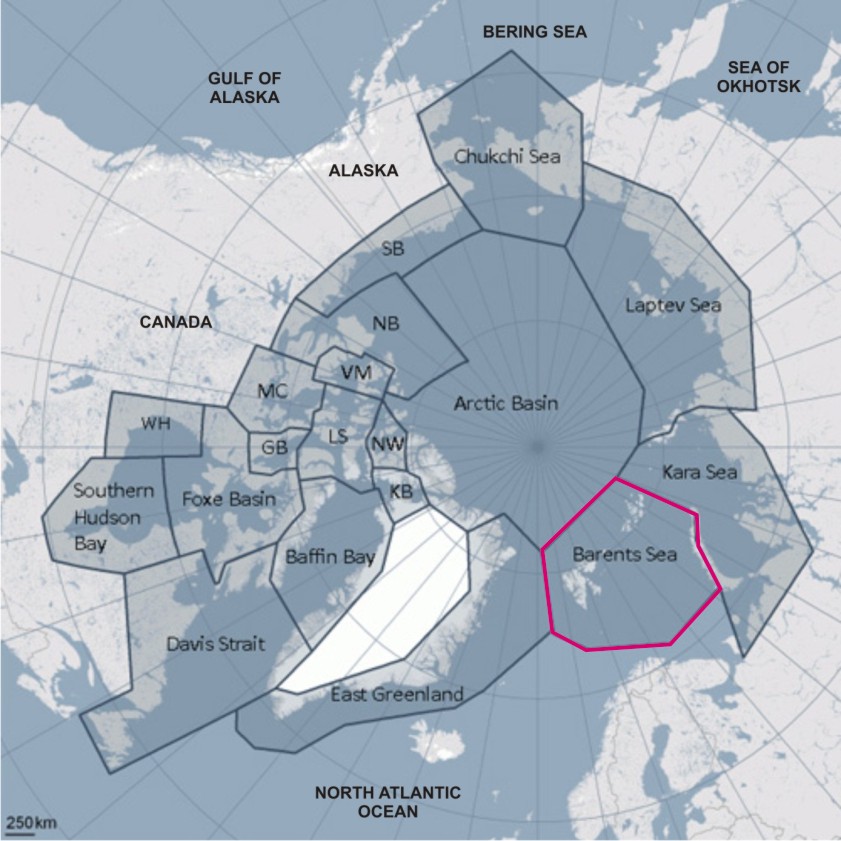
So far, I’ve not discussed the Barents Sea subpopulation in very much detail, except in comparison to other groups. For example, the Barents is considered to be the same type of sea ice “ecoregion” as the Chukchi Sea and the Southern Beaufort (discussed here). Previous studies on the Barents Sea polar bear population (Derocher 2005) indicate it may have recovered from extreme levels of overhunting (discussed here) and had stabilized, or was increasing very slowly, as early as 2002 (discussed here) — similar to what has happened in Davis Strait (discussed here).
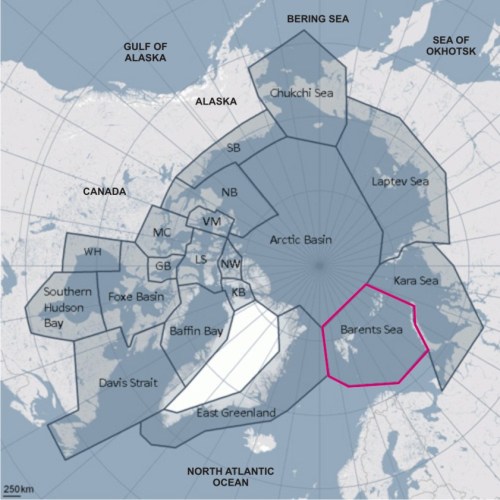
Figure 1. Polar bear subpopulations, with the Barents Sea region highlighted; map courtesy the IUCN Polar Bear Specialist Group (PBSG), extra labels added.
The most recent Barents Sea population estimate was done in 2004 (2,650; range ~1900-3600), based on an aerial survey (Aars et al. 2009). Aerial surveys are the only practical method of establishing population counts in regions like this where many bears never set foot on land. The previous estimate for the Barents (1982) was “2,000-5,000” but its accuracy was considered “poor” (discussed here).
The IUCN Polar Bear Specialist Group (PBSG), in their most recent report, lists the Barents Sea population as “data deficient” for status, current trend and estimated risk of decline within 10 years (Obbard et al. 2010:62, Table 1) and the “notes” for this entry say:
“Population estimate is based on a new aerial survey. There was likely an increase in the subpopulation size after 1973 until recently. Current growth trend is unknown.”
This 2004 estimate is now almost a decade old and potentially no longer an accurate representation of what’s happening in the Barents Sea. The most up-to-date information has not yet been published but it is available online. It’s eye-opening to say the least, if only that it appears to be yet another example of a polar bear population that is so far not showing signs of being harmed by sea ice declines, as I’ve discussed before (here).
[Update October 15, 2013: I’ve simplified the text discussion and figure regarding the Aars and Andersen denning study from the original posted]
Continue reading


You must be logged in to post a comment.