
This is shaping up to be a banner year for polar bears in Foxe Basin (central Canada), with more ice in this region than there’s been since 1992. Hudson Bay still has a large patch of thick first year ice, more than there has been at this date since 2009, which was a late breakup year.
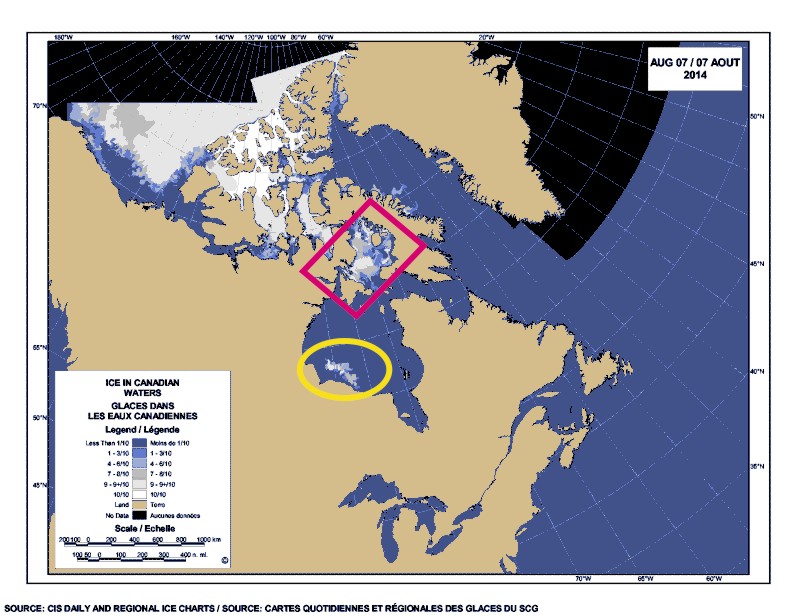
Ice maps and charts below tell the story.
Foxe Basin
The amount of ice remaining in Foxe Basin at this point in the year is quite spectacular, given that we are now well into the melt season (see the chart and graph below).
Lots of hunting habitat for polar bears! In my summary of the status of Foxe Basin polar bears (with references and more maps), I pointed out that this subpopulation is considered healthy and stable.
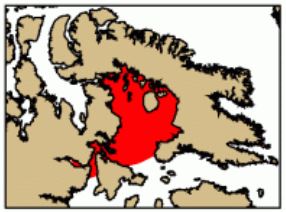
Figure 1. Ice chart by age of ice in Foxe Basin, showing extent of thick first year ice at August 5, 2014. There are major polar bear denning sites in this region. Canadian Ice Service.
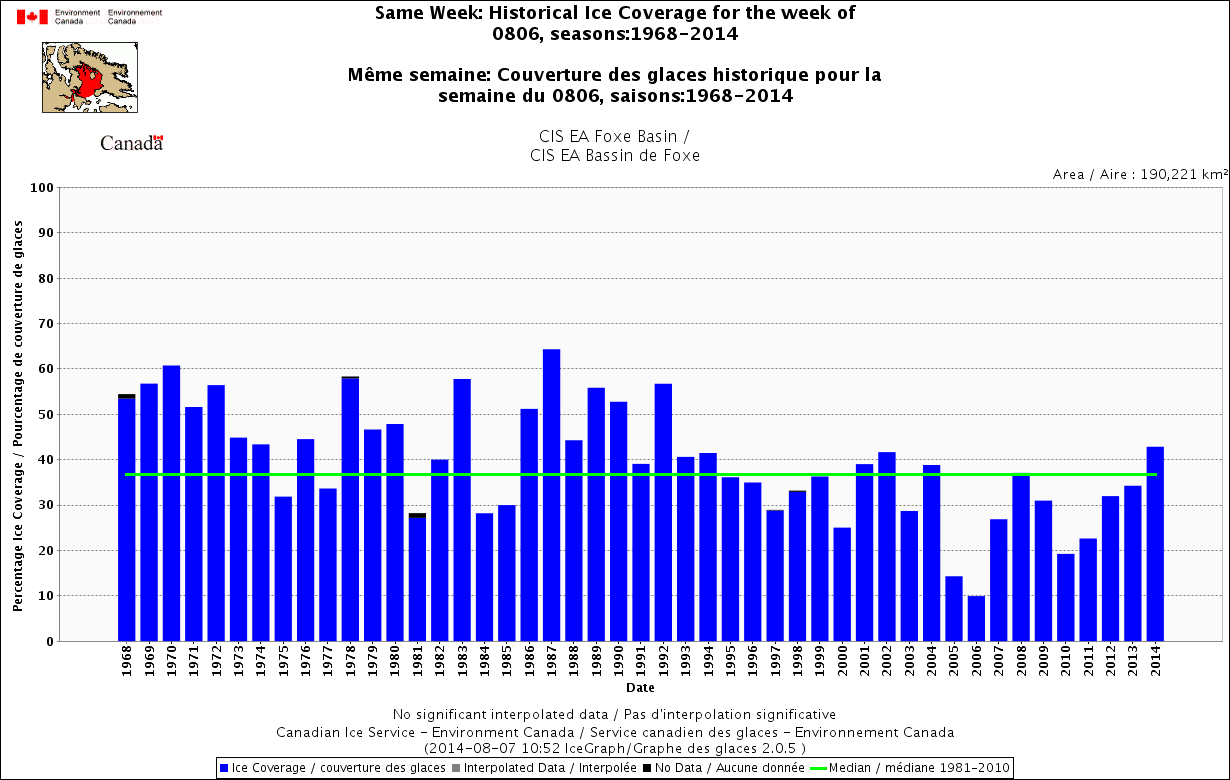
Figure 2. Historical ice coverage for the week of August 6, 1971-2014 for Foxe Basin. Canadian Ice Service graph. Note that ice coverage in 2014 is well above average and higher than it’s been for this date since 1992. Click to enlarge.
Hudson Bay
While the ice on Hudson Bay isn’t breaking any records, there is still more than there has been for the last 5 years — and more ice than average for this date, as the chart and graph below show. Whether bears of the Western Hudson Bay subpopulation are still utilizing this ice is hard to say but I expect there are some still out there.
For background and references, see my post on the history of Hudson Bay breakup dates, “Polar bears of W. Hudson Bay came ashore in 2009 as late as in 1992.” The very persistent ice coverage in 1992 (blamed on the eruption of Mt. Pinatubo), so much higher than other years, really stands out in Fig. 4.
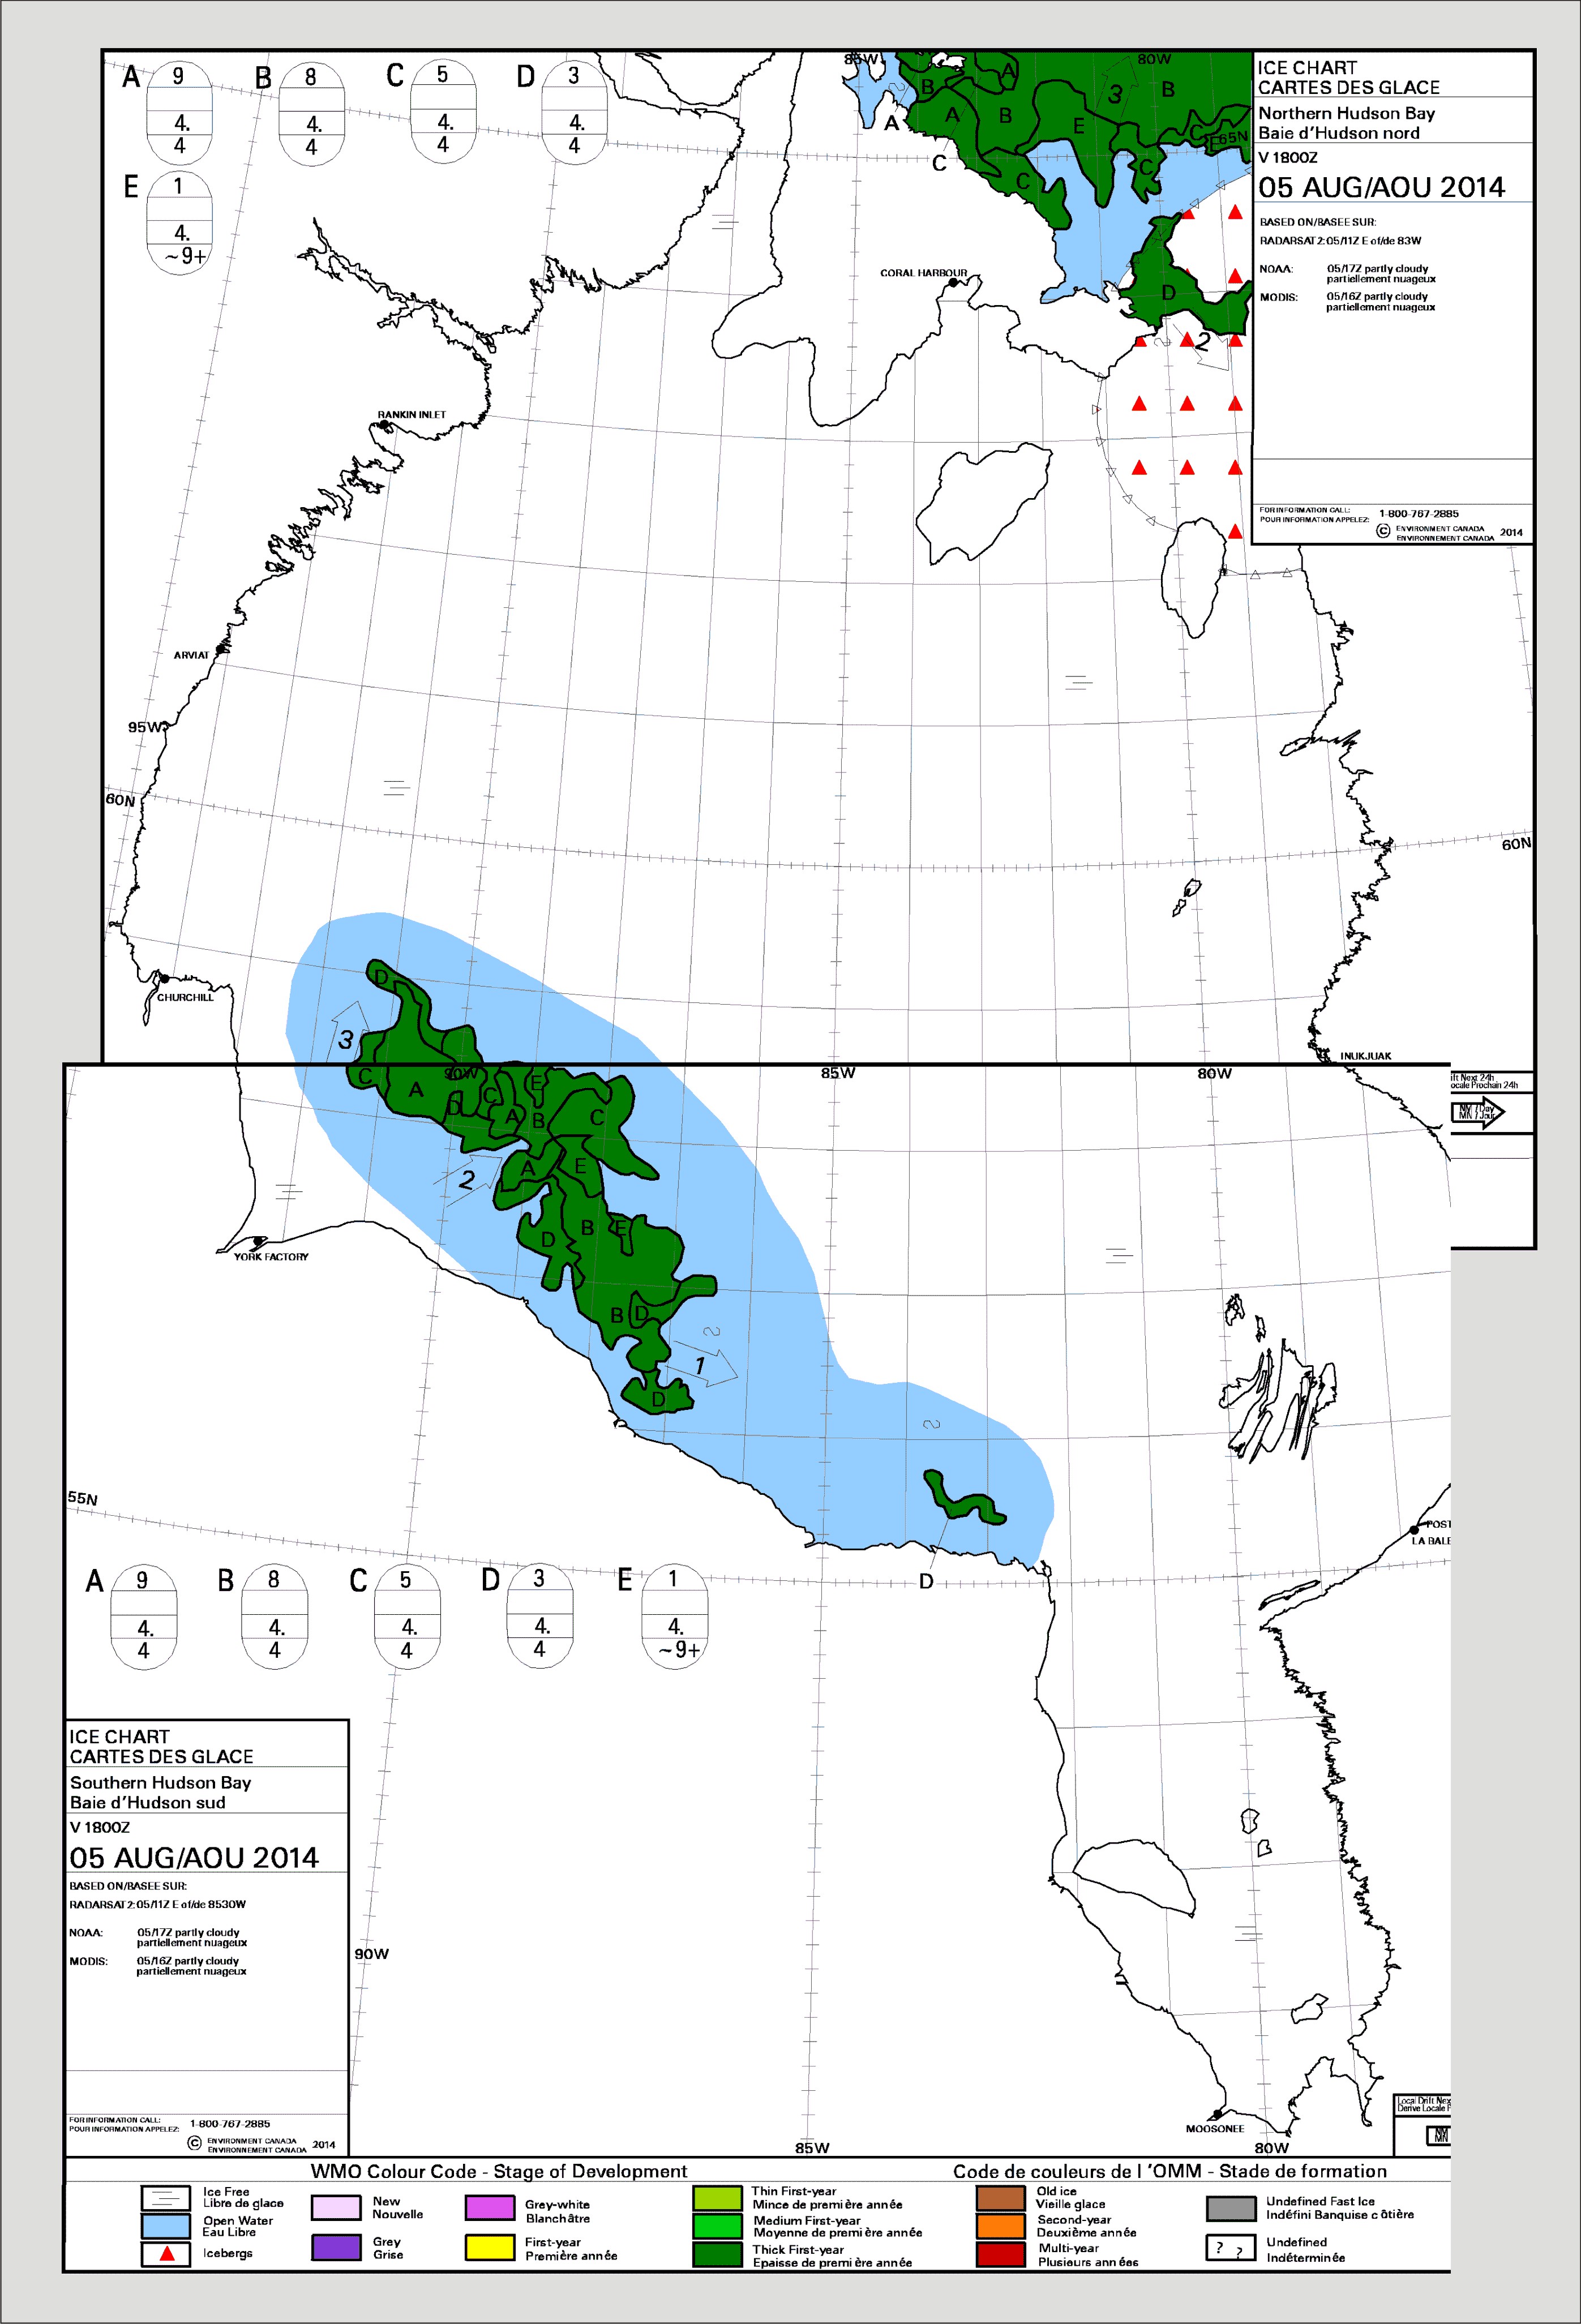
Figure 3. Ice chart by age of ice in Hudson Bay (composite of “South” and “North” HB charts), showing extent of thick first year ice at August 5, 2014. Canadian Ice Service.
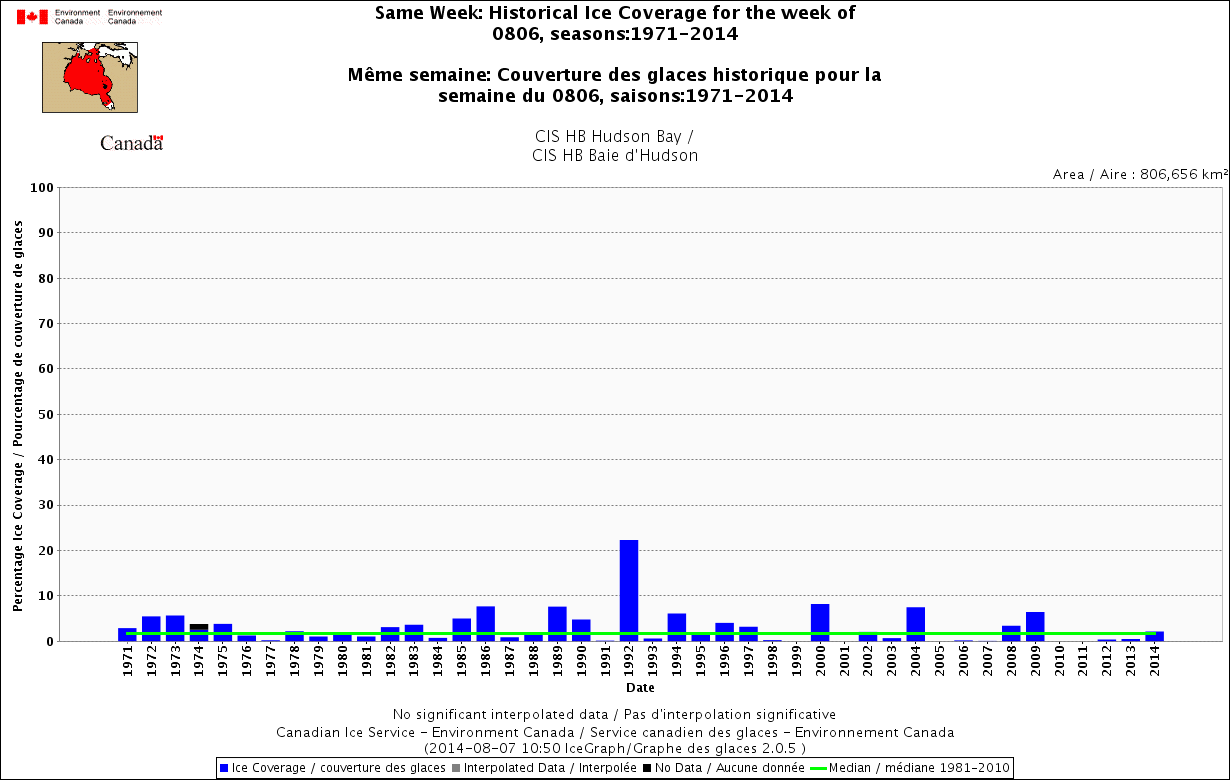
Figure 4. Historical ice coverage for the week of August 6, 1971-2014 for Hudson Bay, showing just above average and the highest since 2009. Ice in 2009 (6th bar from the right) was late breaking up, while 1992 had the highest coverage for this date in the entire record. Canadian Ice Service graph. Click to enlarge.


You must be logged in to post a comment.