
In late January, the IUCN PBSG made significant changes to its polar bear status table but did not think it was worth bringing to the public’s attention via a tweet, press release or note on their web site’s home page.
What changes? Well, while the group did not see fit to agree with all of Environment Canada’s assessments (e.g. listing Davis Strait bears as “likely increasing” compared to the PBSG’s “stable”, see full list here), it did upgrade their status of Western Hudson Bay bears to ‘stable’ (which EC did back in June 2014).
More significantly, however, they also added two metrics of sea ice change to their assessment table, presumably because alongside ‘human-caused removals’ (which they also track in their tables)1, sea ice changes are supposedly critical ‘threats’ to polar bear health and survival.
So critical, in fact, that they’ve only just now gotten around to measuring it consistently across polar bear territory. Funny thing is, they cite no document that shows the sea ice change calculations for each subpopulation region, nor who generated them.
Let me be clear: no one has ever generated such a sea ice metric before – it is a unique PBSG construct that you will find nowhere else. By providing no documentation that lays out the calculations for inspection, the PBSG are simply insisting the public accept their unpublished, non-peer-reviewed work on faith. Details below.
The Lack of Notice
Although there is a “NEWS” section featured prominently on the PBSG website home page for just such an announcement (see screencap below, captured 28 Feb. 2015), no mention is made of this recent change: if you do not go directly to the “STATUS TABLE” page, you would not know these major modifications had been done. I did not realize it had been changed until I saw Kelsey Eliasson refer to it in his Feb 25th blog post at Polarbearalley.

The changes to the PBSG status table have been in place since 24 January 2015 (the date stamp on the page), but we are only just finding out about it now. Which means the PBSG “News” feature is pretty useless for determining quickly if anything is actually new. Do they not understand what the word “news” means or would they just prefer no one knows about their changes? Very odd behaviour for scientists, in my opinion.
Defining the Ice Metrics
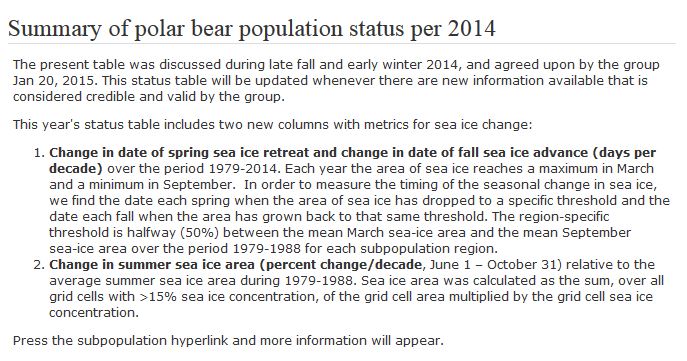
The PBSG the ice metrics that are now critical to track, are defined as follows:
“Change in date of spring sea ice retreat and change in date of fall sea ice advance (days per decade) over the period 1979-2014” and “Change in summer sea ice area (percentage change/decade, June 1-October 31) relative to the average summer sea ice area during 1979-1988.”
See the entire explanations provided on the PBSG “Status Table” page.
Several issues of note:
1) The PBSG has decided, without justification, that summer for their sea ice metrics will be a five month period that runs from June to October. Note that in published papers, polar bear biologists (e.g. Pilfold et al. 2015, in press) and other Arctic researchers define Arctic seasons in four three-month segments: Winter – January to March; Spring – April to June; Summer – July to September; Fall – October to December.
How, I wonder, will this treatment distinguish between years of abundant ice until the end of June followed by a very low September coverage (like 2012, for which there has been no reported evidence of harm to polar bears), and an early spring ice melt-back in early-mid June followed by a moderately low September coverage (which would almost certainly be much more harmful to the bears). In terms of the ice metrics proposed, it seems to me these situations would look very similar yet have very different biological outcomes. See also point 4 below.
2) The “mean” against which all sea ice changes relevant to polar bears will be measured by the PBSG is the 10-year period from 1979-1988. You read that right – ten years. Apparently, the PBSG feels it is OK to redefine “climate” to suit their purposes: even the US National Snow and Ice Data Center (NSIDC) has stated that they use a 30 year period to establish sea ice extent and area means because 30 years is the “standard baseline period for weather and climate” (see footnote below).2
3) There is no mention of the difficulty that satellites have in correctly interpreting the presence of sea ice during the early summer melt season (which these metrics focus squarely upon: see quote below3 describing this issue) – PBSG members themselves raised that issue at their last meeting, stating that “recent analysis shows that up to 20% of locations of collared females are in areas where the ice data indicates there is no ice.” [pg . 23 in the minutes of the July 2014 PBSG meeting here]
4) There is no estimation of the potential error (i.e., standard deviation, as per Perovich and Richter-Menge 2009:424). Plus or minus for the population estimates are provided, why the faux precision for sea ice changes?
5) Lastly, and probably related to point 1 above, the new PBSG sea ice metric is at odds with a claim made in a recent polar bear paper that East Greenland has experienced “some of the largest rates of sea ice loss” of all Arctic regions (Laidre et al. 2015 in press: abstract, see previous post here).
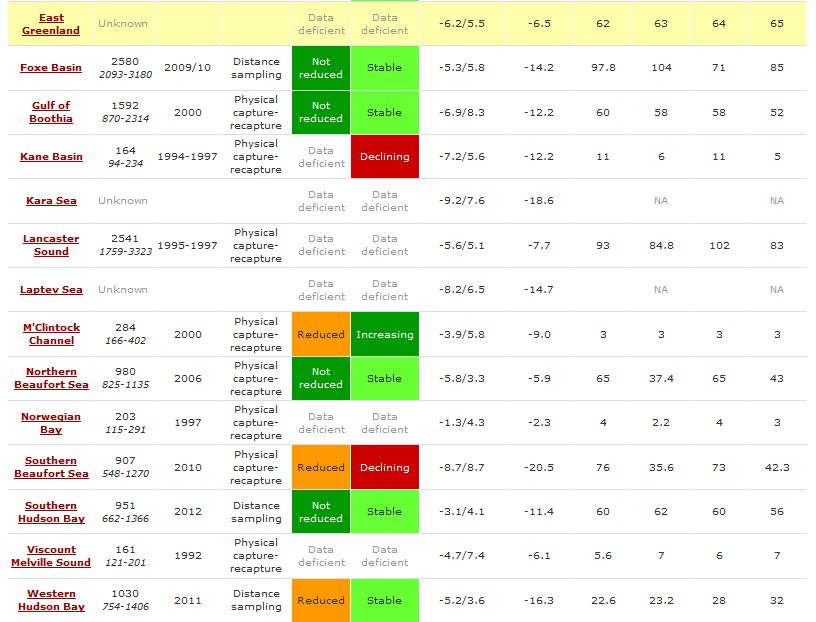
Listed in the PBSG status table as having had a sea ice change of -6.5% per decade over the newly-defined “summer” (see screencap below, pdf here), East Greenland thus had the fourth lowest amount of change of all 19 regions. So which which metric is actually the most biologically relevant to polar bear health in East Greenland?
Laidre and colleagues might not be pleased at the contrast with their East Greenland ice assessment (note the May/June matching):
“Based on the historical record, the pack ice of EG has receded at an average rate of -9.8 % per decade from 1979 to 2006 (Perovich and Richter-Menge 2009), with the rate varying from -6 % per decade in May and June to -16 % per decade in August and September. The rate of sea ice loss during winter (October–March) has been between -8.3 and -10.6 % per decade, while loss rates during summer (July–September) have ranged between-9.3 and-16.1 % (Ibid.)”
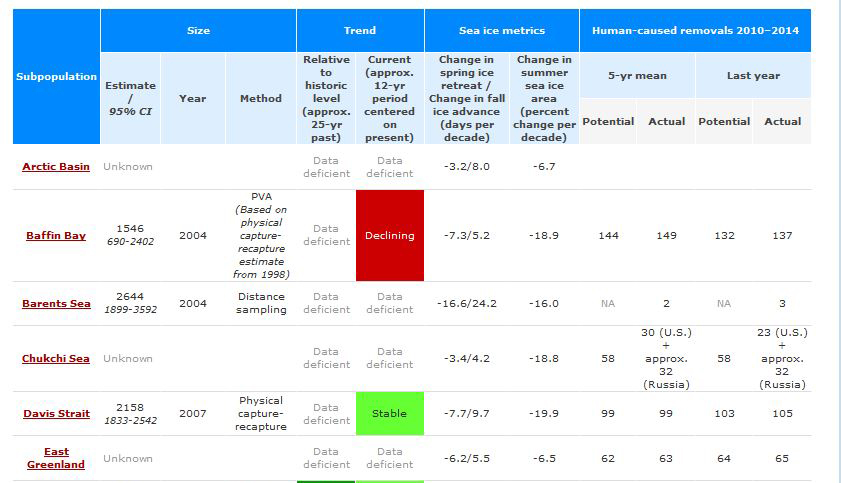
Top half of new PBSG (2014) table (click to enlarge):
Bottom half of table of PBSG (2014) table (click to enlarge):
Footnote 1. To accommodate the new sea ice metric data in their assessment table, the PBSG removed previous two columns that described “human-caused removals” using a 3-yr mean (“5-yr mean” and “Last year” have been retained).
Footnote 2. NSIDC’s “Frequently Asked Questions on Arctic sea ice”
“NSIDC scientists use the 1981 to 2010 average because it provides a consistent baseline for year-to-year comparisons of sea ice extent. Thirty years is considered a standard baseline period for weather and climate, and the satellite record is now long enough to provide a thirty year baseline period.” [my bold; 1 March 2015; screencap below, click to enlarge].

Footnote 3. Scott and Marshall (2010:156) on systematic underestimation of microwave data:
“The accuracy of the concentration data is stated to be at its worst, at ±15% of the actual sea-ice concentration (Cavalieri et al., 1992), during summer in the Arctic, which unfortunately corresponds to the time of breakup we are interested in. The low accuracy is largely due to the effects of surface melt ponds on the sea ice, which can lead to underestimation of the sea-ice concentration. In addition, at the ice margins and areas of ice breakup, the many different concentrations that can exist within one pixel will be smoothed to an average figure. Several studies have shown that because of the surface melt, in particular, the passive microwave-derived data tend to systematically underestimate ice concentrations (e.g. Agnew and Howell, 2003; Shokr and Markus, 2006). When compared to sea-ice charts, the passive microwave sea-ice concentrations derived from the NASA Team algorithm were found to underestimate concentration during summer melt by 20.4% to 33.5%. The improved NASA Team 2 algorithm has been shown to underestimate concentration by 18.35% on average, with a standard deviation of 16.8% (Shokr and Markus, 2006). These studies suggest that although a random error of around 15% is still reasonable, there will be a systematic underestimation of ice concentration in the passive microwave concentration data set.” [my bold]
Scott and Marshall (2010:157) also suggested that Canadian Ice Service (CIS) daily and weekly charts may be “more accurate than passive microwave data for estimates of ice concentration, particularly in the presence of surface melt,” although more satellite data are now more likely to be incorporated by CIS into their analyses than previously (i.e., before 1987).
References
Perovich, D.K. and Richter-Menge, J.A. 2009. Loss of Sea Ice in the Arctic. Annual Review of Marine Science 1:417–441. DOI: 10.1146/annurev.marine.010908.163805
Pilfold, N. W., Derocher, A. E., Stirling, I. and Richardson, E. 2015 in press. Multi-temporal factors influence predation for polar bears in a changing climate. Oikos. http://onlinelibrary.wiley.com/doi/10.1111/oik.02000/abstract
Scott, J.B.T. and Marshall, G.J. 2010. A step-change in the date of sea-ice breakup in western Hudson Bay. Arctic 63:155-164. Open access http://arctic.synergiesprairies.ca/arctic/index.php/arctic/issue/view/55


You must be logged in to post a comment.