Tag Archives: satellite data

When was the earliest ice breakup year for Western Hudson Bay polar bears?

Was 1990 really the earliest ice breakup year for Western Hudson Bay polar bears – and why aren’t breakup dates derived from the same data identical? Two serious questions that need answering.

Sea ice extent Canada 2015 June 17 CIS

The suggestion a few weeks ago by Andrew Derocher that the unusual breakup pattern of sea ice breakup in Hudson Bay this year might set a new record reminded me how often I’ve questioned the claim that 1990 had the earliest breakup for WHB since 1971.

I call this date into question for two reasons: 1) sea ice maps and charts like those shown below suggest an early breakup in 1990 was not possible, by any definition of the term; 2) none of the research reports on WHB bears, for periods that included 1990, mention that breakup in 1990 was especially early, even though many commented (often at length) about the especially late breakup in 1992.

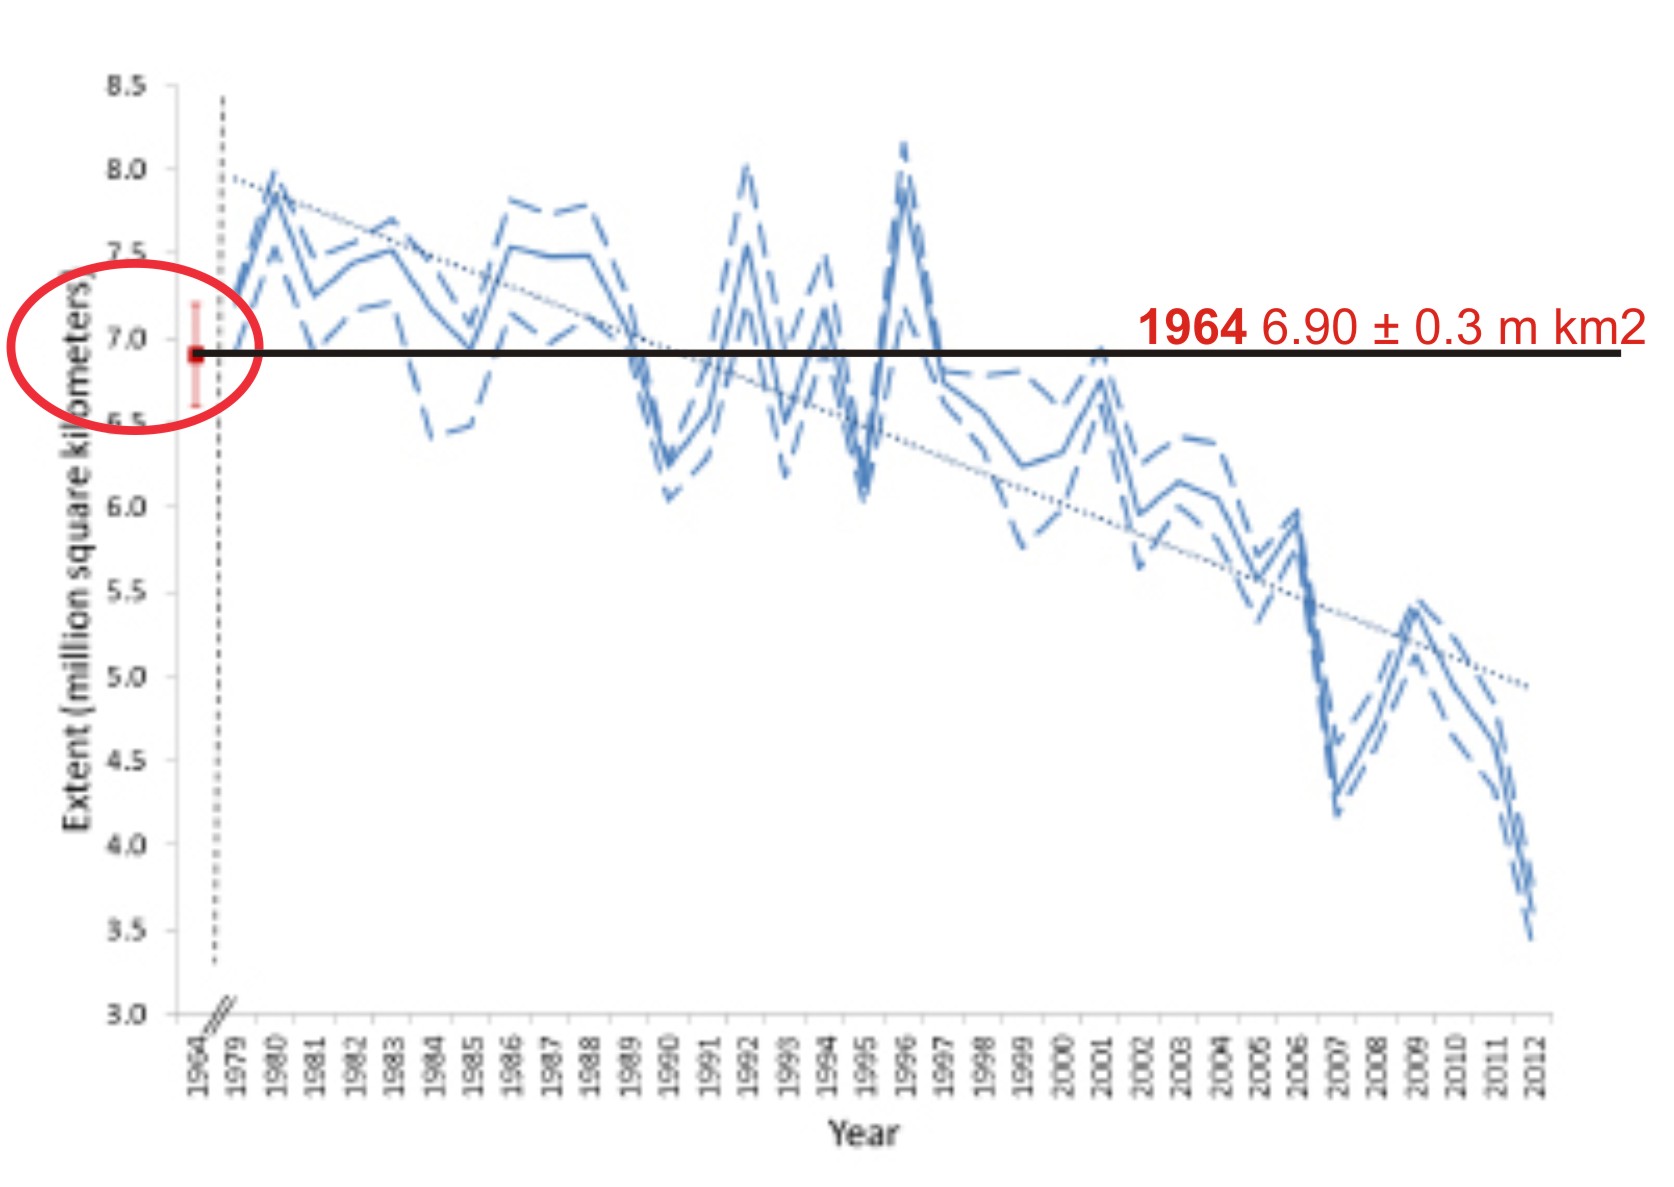
How much does this very early breakup in 1990 contribute to the apparent declining trend in breakup dates since 1979?1  Is the early breakup date in 1990 real, perhaps a bizarre consequence of analyzing the data square-by-square over a grid? Or, were there errors in 1990 sea ice data that eventually got corrected by sea ice folks but not by polar bear biologists?

UPDATE 17 June 2015 PDF HERE of this post, with higher resolution images, for those who want to explore the questions I’ve posed or share them.
Continue reading

IUCN Specialist Group quietly adds “sea ice changes” to their polar bear status table

In late January, the IUCN PBSG made significant changes to its polar bear status table but did not think it was worth bringing to the public’s attention via a tweet, press release or note on their web site’s home page.

Hudson Bay female with cub_Wapusk_Thorsten Milse_Gov CA

What changes? Well, while the group did not see fit to agree with all of Environment Canada’s assessments (e.g. listing Davis Strait bears as “likely increasing” compared to the PBSG’s “stable”, see full list here), it did upgrade their status of Western Hudson Bay bears to ‘stable’ (which EC did back in June 2014).

More significantly, however, they also added two metrics of sea ice change to their assessment table, presumably because alongside ‘human-caused removals’ (which they also track in their tables)1, sea ice changes are supposedly critical ‘threats’ to polar bear health and survival.

So critical, in fact, that they’ve only just now gotten around to measuring it consistently across polar bear territory. Funny thing is, they cite no document that shows the sea ice change calculations for each subpopulation region, nor who generated them.

Let me be clear: no one has ever generated such a sea ice metric before – it is a unique PBSG construct that you will find nowhere else. By providing no documentation that lays out the calculations for inspection, the PBSG are simply insisting the public accept their unpublished, non-peer-reviewed work on faith. Details below.
Continue reading

NSIDC says the sea ice minimum in 1964 was not different from 1979, 1981, or 2001

I just came across the National Snow and Ice Data Center (NSIDC) “monthly highlights” article for April 2013 (Glimpses of sea ice past), which turned out to be a rather more interesting story than it appeared at first glance.

The article chronicles the details of how NSIDC technicians pieced together photos taken by the Nimbus 1 satellite between August 28 and September 23, 1964 – of both the Arctic and the Antarctic – to create an estimate of sea ice extent at September 1964 for both regions. For the Arctic, this was the yearly minimum; for the Antarctic, the yearly maximum.

NSIDC scientist Walt Meier was part of this effort and he and colleagues Gallaher and Campbell recently published their findings in the journal The Cryosphere (Meier et al. 2013). For the Arctic estimate, they had to add in data from Alaskan and Russian sea ice charts because the 1964 satellite data was not complete. This means the ice extent figure they came up with is not a true ‘satellite only’ figure but a composite one.

One of the things they did in their analysis was to place the 1964 value on a graph of the more recent 1979-2012 data, which really helps put it into perspective (see Fig. 1 below).

Figure 1. This is Fig. 7 from the Meier et al. 2013 paper, to which I’ve added labels. Meier et al. call this a “time series of Arctic September sea ice extent.” The estimate for 1964 is the red dot on the far left (with its error bars), which I’ve circled (I also added the red label for 1964 and the black line). Note the Y-axis on the left goes to 3.0 million km2, not zero. The solid blue line is the monthly average for September from passive microwave data (1979-2012), and the blue dashed lines are a “three-day average of the high and low range of daily extents during the month.” The 1964 estimate of 6.90 ± 0.3 million km2 is just about identical to 1979, 1981, and 2001 and well within the average for 1979-2000. However, it’s significantly lower than the previous estimate of 8.28 million km2 for 1964 made by the UK Hadley Centre in 2003 (Meier et al. 2013:704).

Figure 1. This is Fig. 7 from the Meier et al. 2013 paper, to which I’ve added labels. Meier et al. call this a “time series of Arctic September sea ice extent.” The estimate for 1964 is the red dot on the far left (with its error bars), which I’ve circled (I also added the red label for 1964 and the black line). Note the Y-axis on the left goes to 3.0 million km2, not zero. The solid blue line is the monthly average for September from passive microwave data (1979-2012), and the blue dashed lines are a “three-day average of the high and low range of daily extents during the month.” The 1964 estimate of 6.90 ± 0.3 million km2 is just about identical to 1979, 1981, and 2001 and well within the average for 1979-2000. However, Meier and colleagues note it is significantly lower than the previous estimate of 8.28 million km2 for 1964, made by the UK Hadley Centre in 2003.

Continue reading