
My request to Environment Canada in early December 2014 for the documents supporting their polar bear status maps has finally generated results.
In an email dated 2 March 2015, I received the document produced by the EC Polar Bear Technical Committee (PBTC). I waited to see if it would be appended to the webpage where the maps were posted last year (reported here and here). However, as of today, that has not happened, so I am posting it here. There are some rather striking differences that may surprise you.
UPDATE 22 March 2015: A copy of the letter from the Director General of the Canadian Wildlife Service that accompanied the document below, which I forgot to include, is here. It states that the once a new status table has been compiled (provided below), “it is reviewed by the Polar Bear Administrative Committee and then becomes a public document.” The implication is that the reviewed document has not yet been produced.
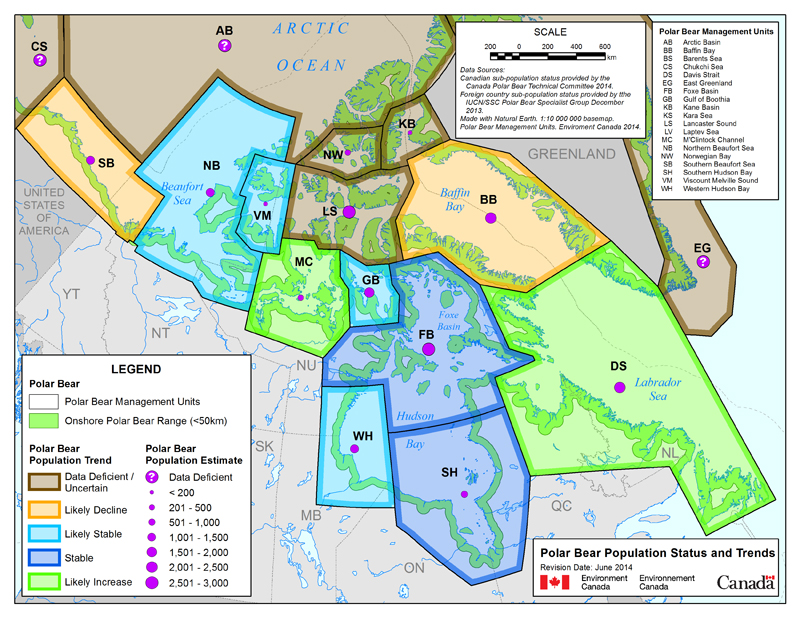
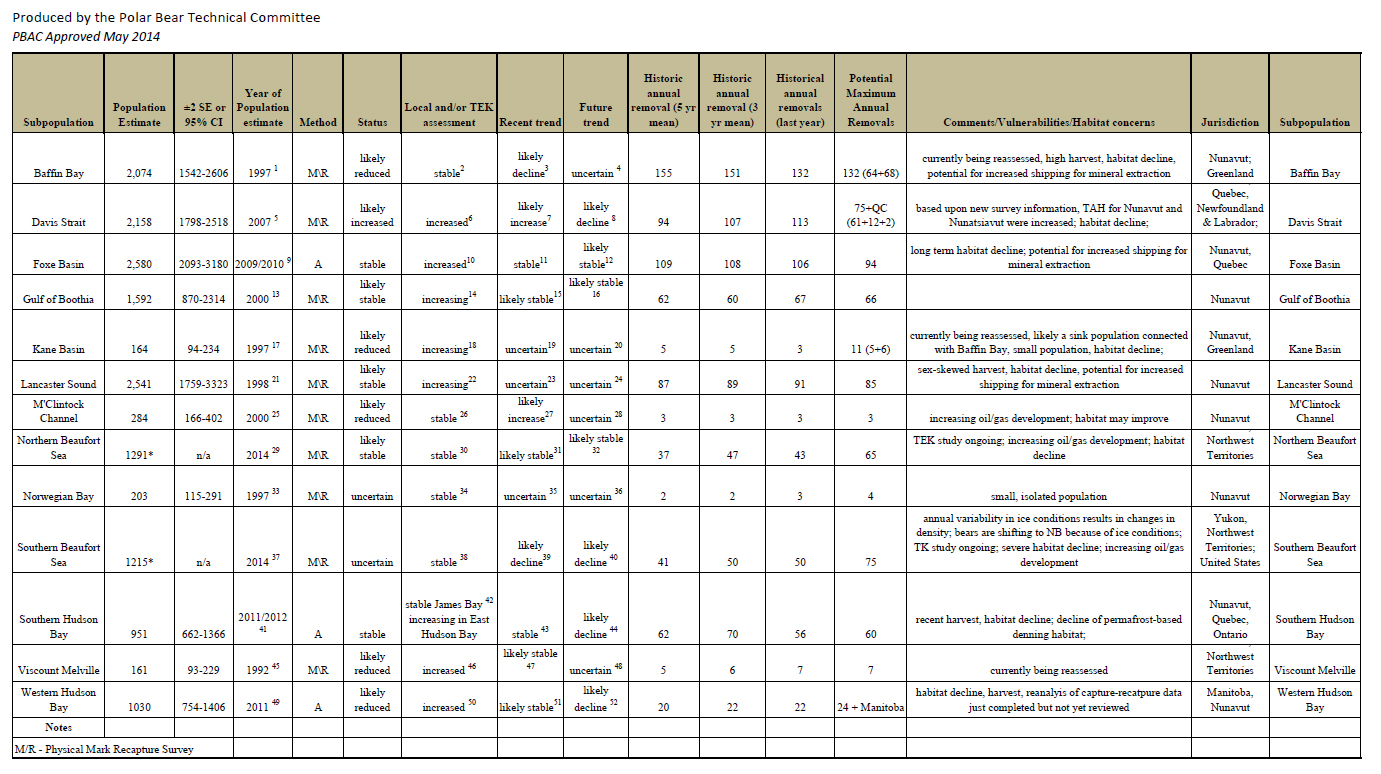
The document is essentially a table with explanations, not unlike the table produced by the IUCN Polar Bear Specialist Group (PBSG). The PBTC table is copied below (you will have to click to enlarge for it to be readable).
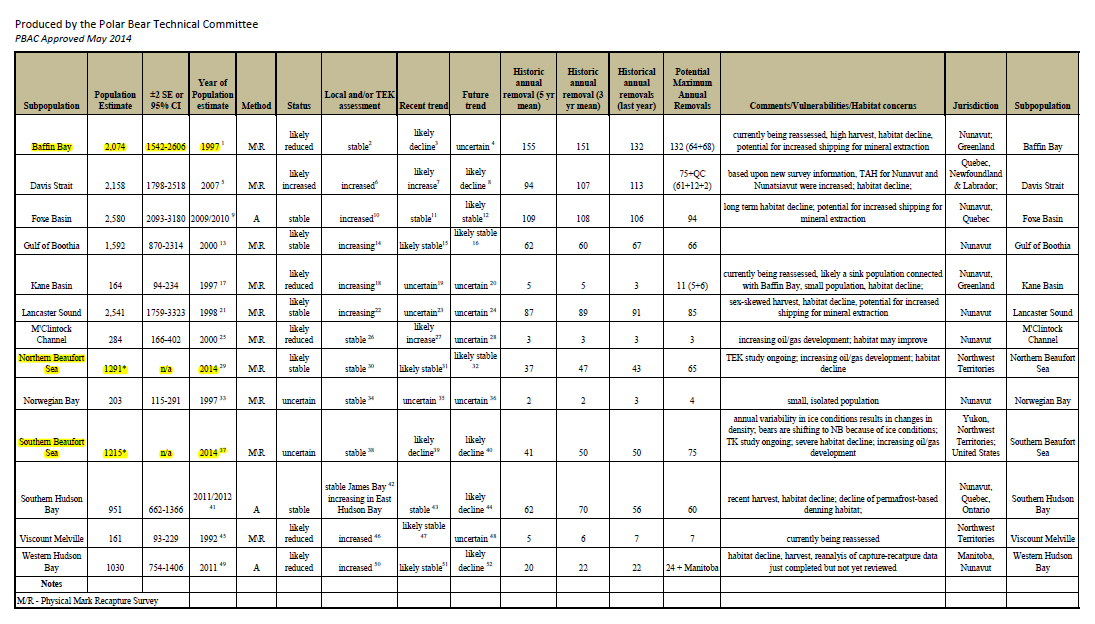
The most striking differences between the IUCN PBSG and EC PBTC are the population estimate numbers for Baffin Bay, Northern Beaufort Sea and Southern Beaufort Sea.
PBSG: N. Beaufort Sea 980 (825-1135) dated 2006;
PBTC: N. Beaufort Sea 1291 (n/a) dated 2014 [note 29. “PBTC 2014 (NWT, Stirling et al. 2011)”]
PBSG: S. Beaufort Sea 907 (548-1270) dated 2010;
PBTC: S. Beaufort Sea 1215 (n/a) dated 2014 [note 37. “PBTC discussion 2014 (NWT, USGS 2010)”]
PBSG: Baffin Bay 1546 (690-2402) dated 2004;
PBTC: Baffin Bay 2074 (1542-2606) dated 1997 [note 1. “(Taylor et al. 2005)”]
The EC Polar Bear Technical Committee provides higher population estimates for all three of these subpopulations than does the IUCN PBSG. The total difference amounts to 1,147 bears (3433 vs. 4580) — that’s a rather large difference of opinion between the two groups of experts.
In addition, it appears that the EC estimate for the Southern Beaufort supports my contention that the USGS study was ended prematurely in 2010 and that the SBS population had indeed rebounded to previous levels by 2012 (discussed here and here). The higher EC PBTC estimate for the Southern Beaufort presumably takes into account the recent boundary change between SBS and NBS (which reduced the total area of SBS within Canada, described here), and the fact that some SBS bears seem to have moved into NBS, as noted in the table.1
The pdf marked with a few pertinent details is here. The unmarked version is here.
Unmarked version of table alone (jpeg) is below:
Footnote 1. It is worth noting here that the USGS press release stated that their 2010 figures would be used in the upcoming IUCN polar bear assessment, as I discussed previously here; the IUCN assessment needs a population estimate that shows a declining trend to help ensure that polar bears will again be listed as ‘vulnerable’ in the next IUCN Red List.


You must be logged in to post a comment.