
Not much change in sea ice coverage since last week – most of Hudson Bay is still covered with concentrated ice, which is good news for Western and Southern Hudson Bay polar bears. They are still free to roam and hunt over most of the ice-covered bay.
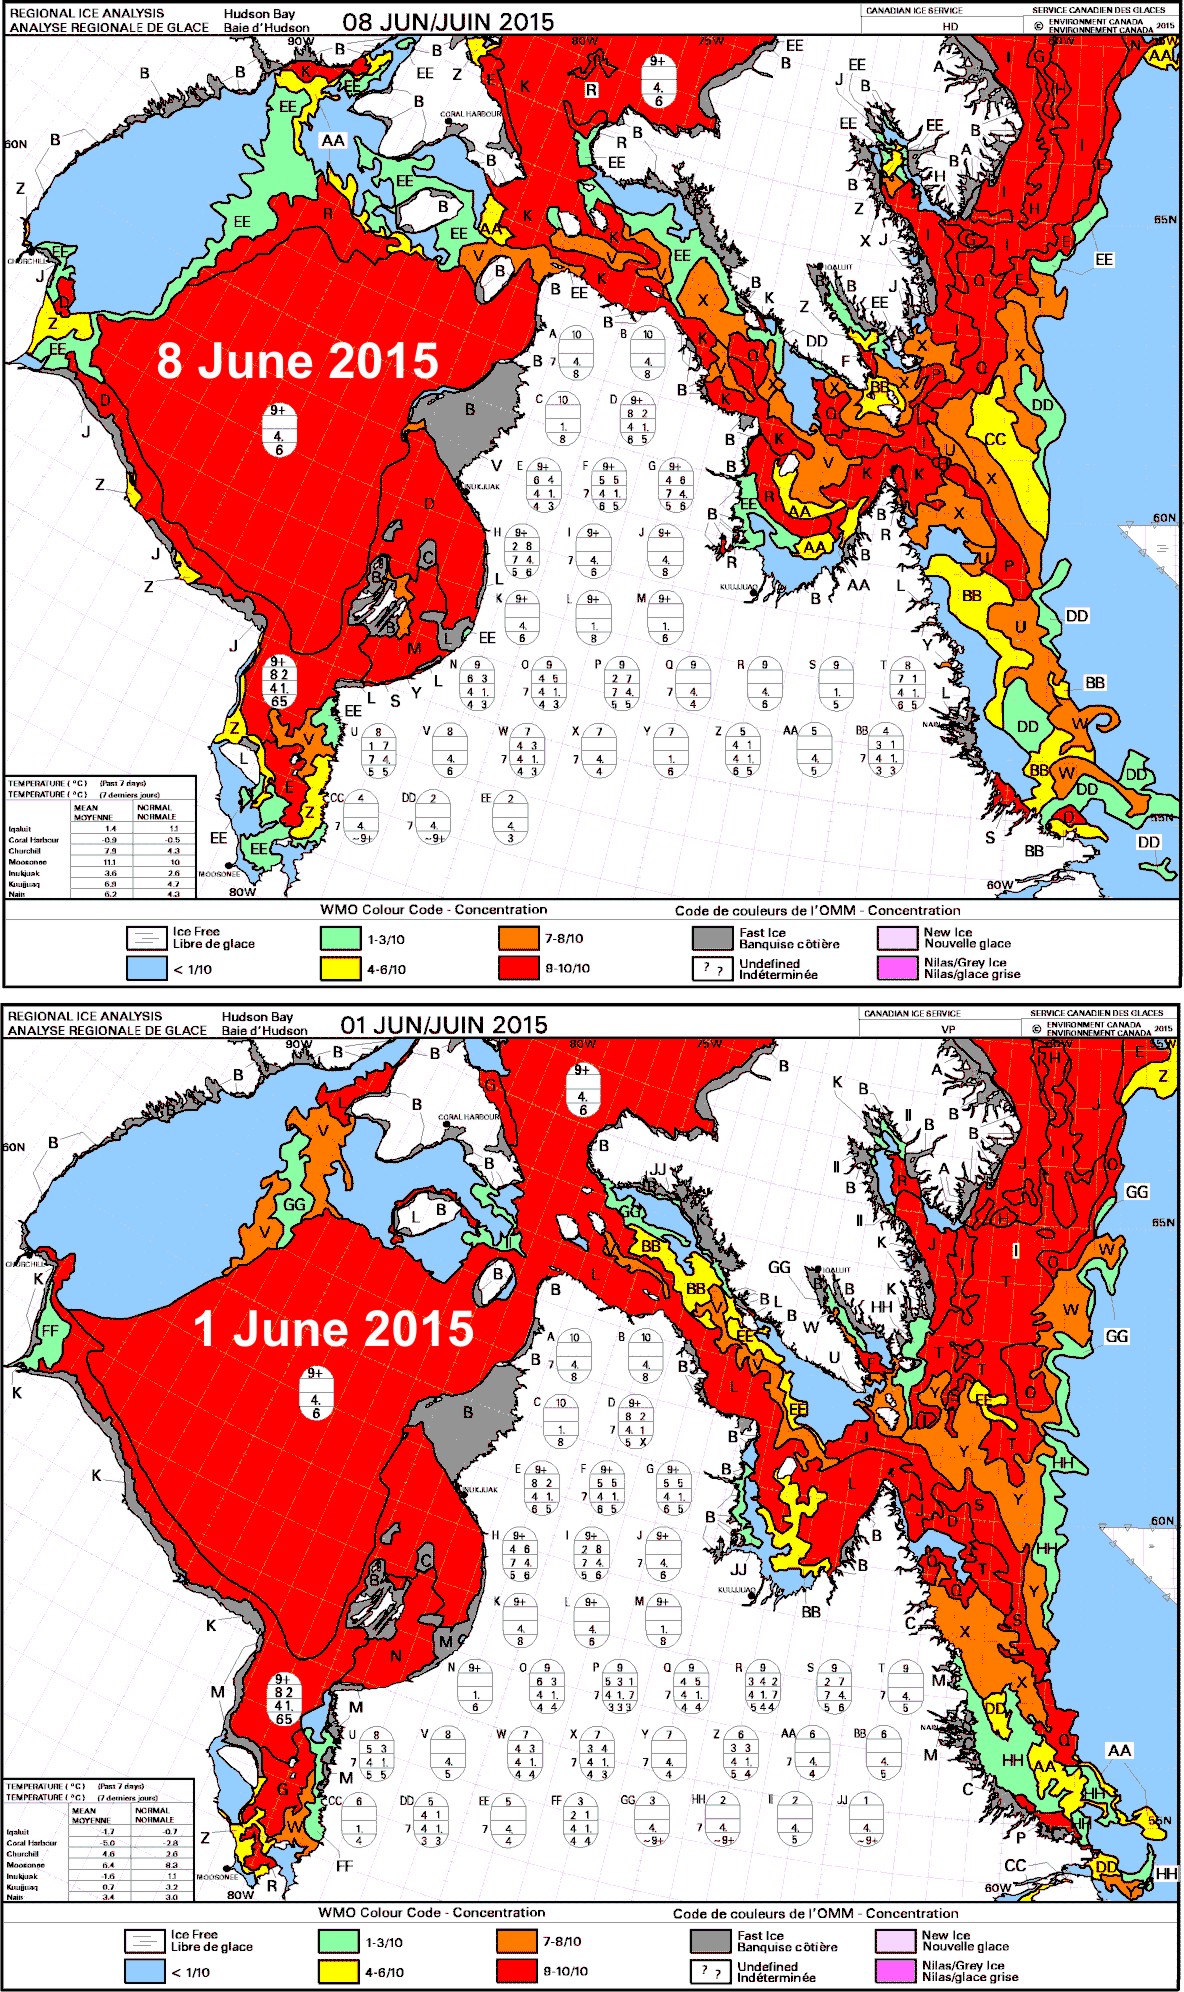
There may be slightly less ice than average for this time of year (Fig. 1, below) but coverage is still >70% with concentrated ice and does not appear to be melting quickly (see charts above and Fig. 2, below).
The dates for three previous earliest breakups according to Lunn and colleagues (Fig. 3) have come and gone, as all were in the first week of June (more on that in an upcoming post) – no records broken. More graphs and maps below, see previous posts here and here.
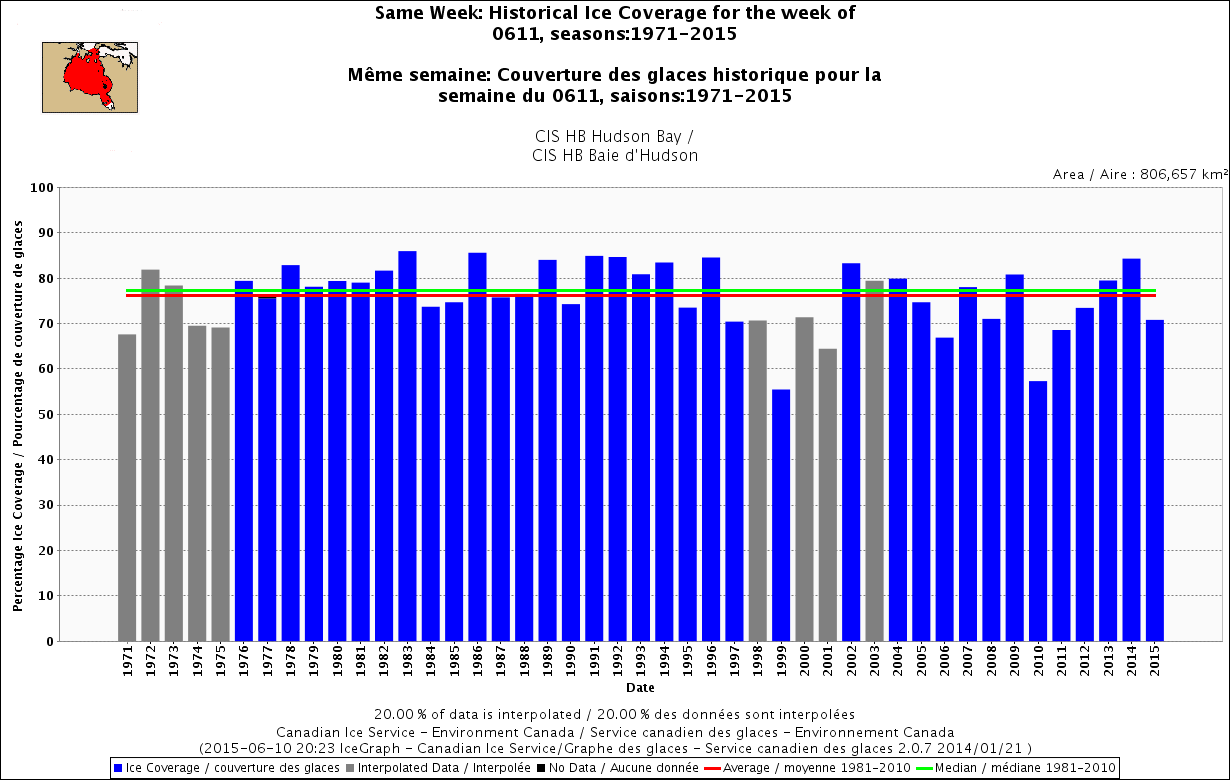
Figure 1. Sea ice coverage, by percentage, 1971-2015 for the week of 11 June. Canadian Ice Service. Click to enlarge.
Here’s how it looks (Fig. 2) in normal view:
Figure 2. Sea ice concentration in Canada at 10 June 2015. Click to enlarge.
Below are the breakup dates according to Lunn et al. (2013) for Western Hudson Bay, defined as the date when sea ice reaches 50% coverage (calculated over a grid):
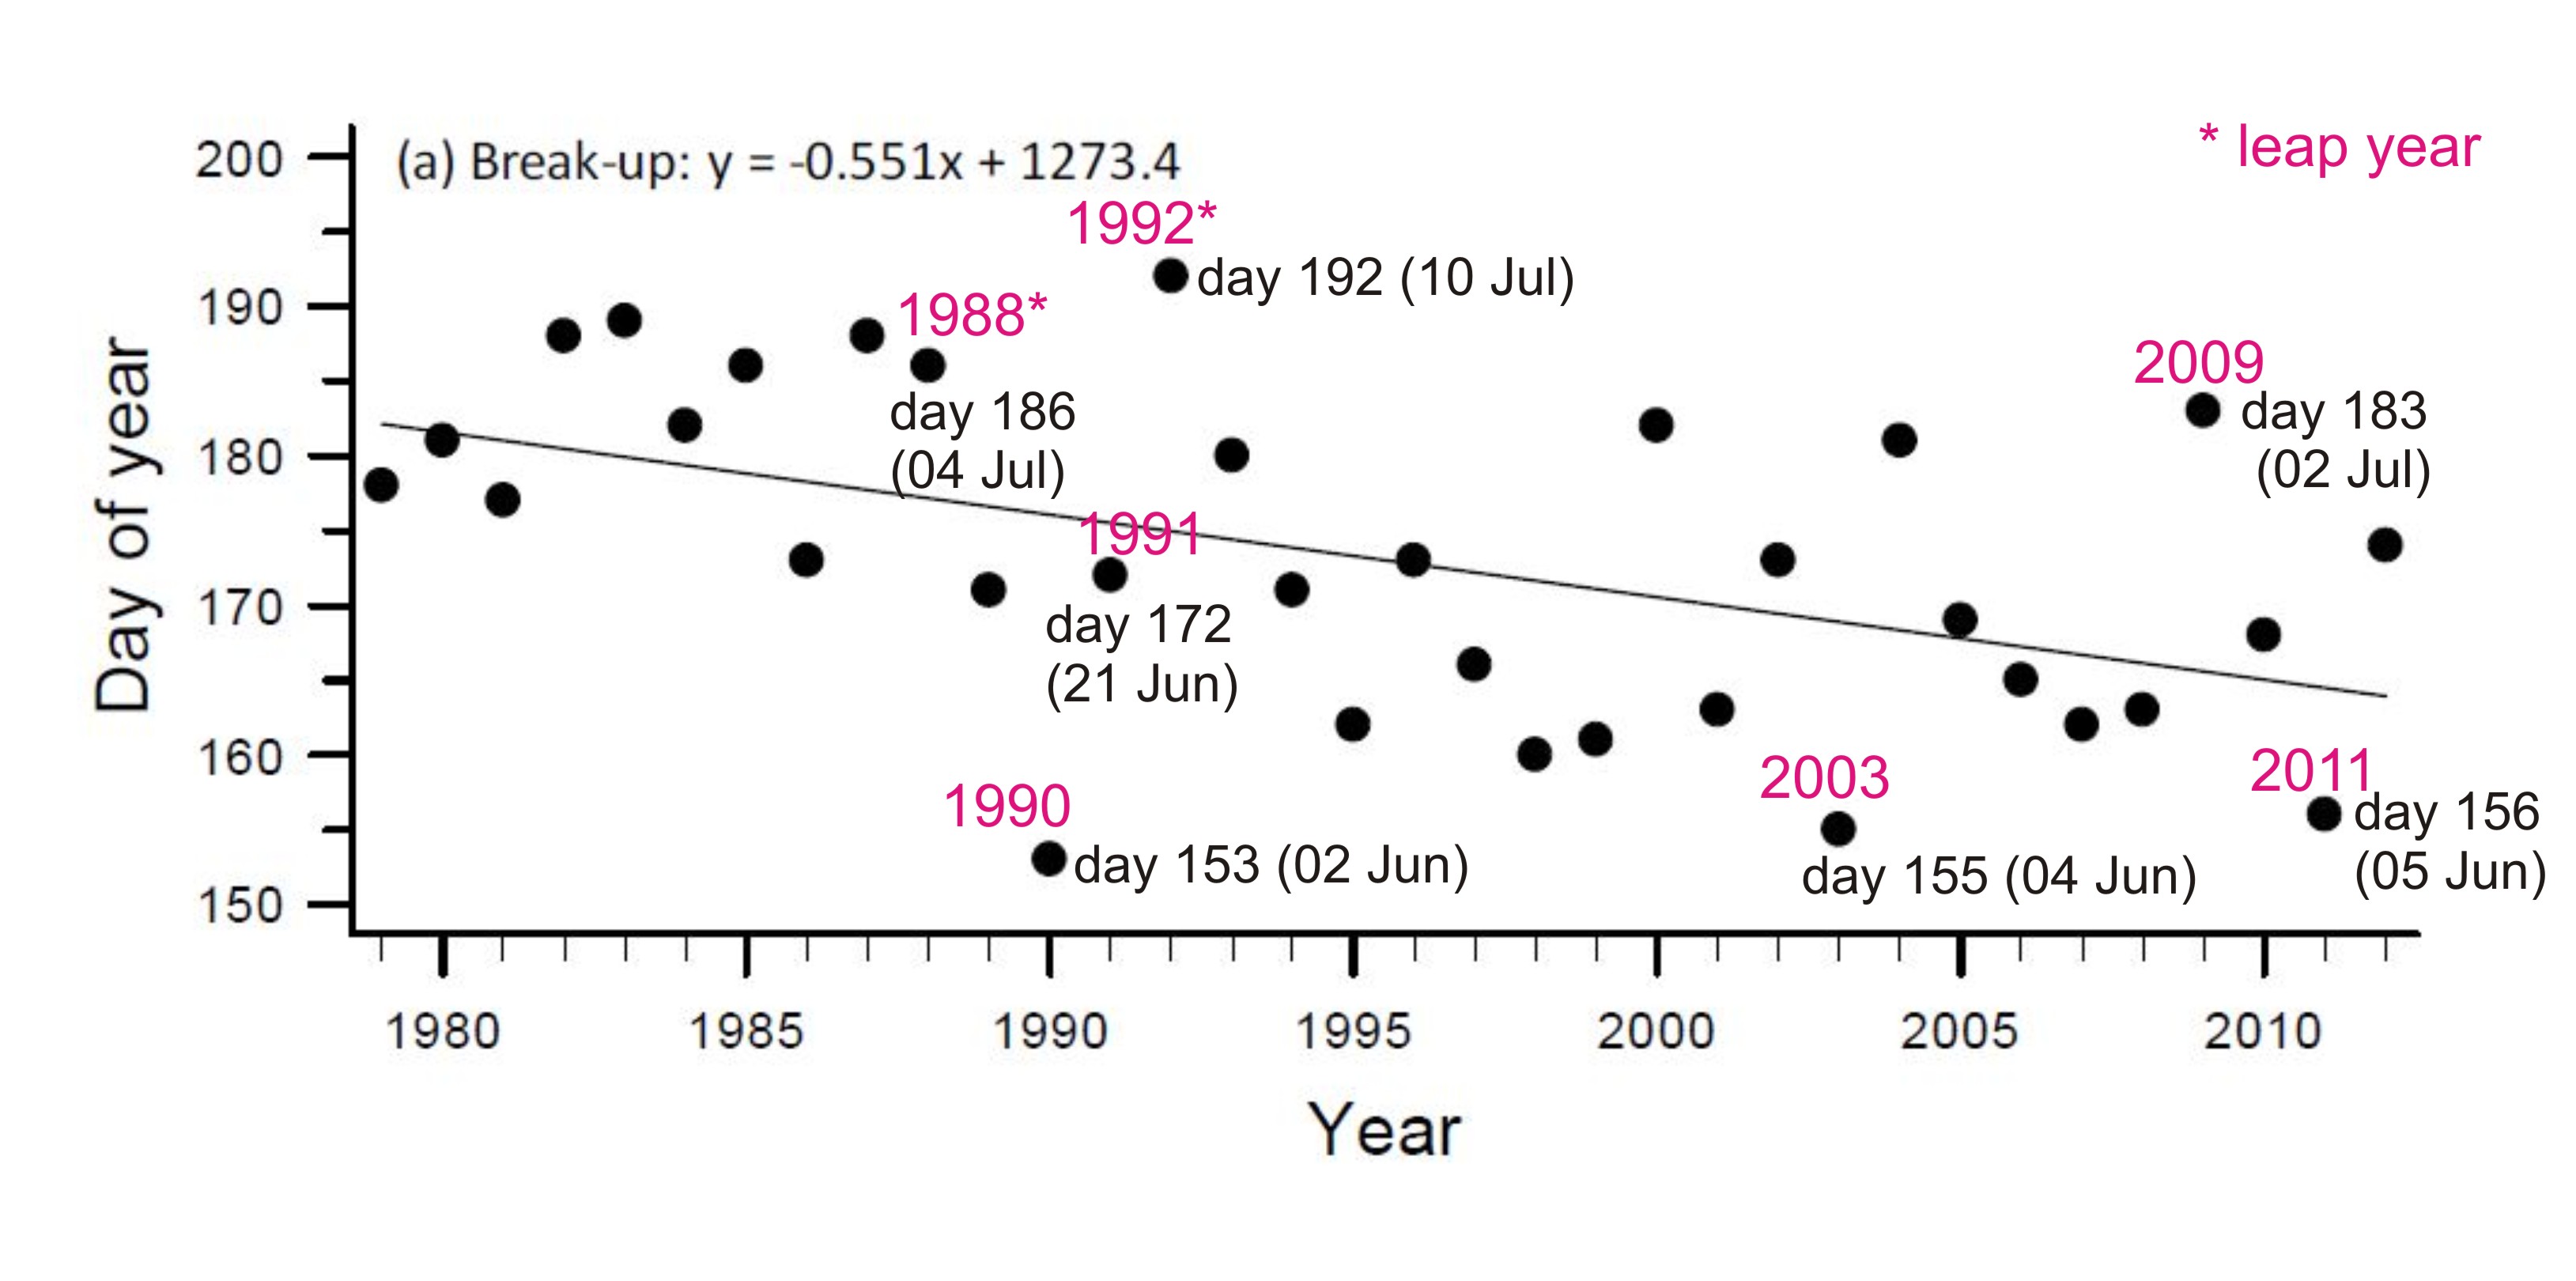
Figure 3. Breakup dates for Western Hudson Bay 1986-2012, according to Lunn et al. 2013. My date labels. Click to enlarge.
Below (Fig. 4), compare sea ice coverage over Hudson Bay at 8 June 2015 (centre) to the same date in 2009 (a late breakup year, July 2), and 2011 (an early breakup year, June 5) – breakup dates according to Lunn and colleagues (Fig. 3), ice coverage courtesy NSIDC MASIE.
Note the amount of ice in each of the three coloured areas and see that in 2015, there was less open water in Hudson Strait (magenta) and eastern Hudson Bay (yellow) than there was in 2009 – despite the larger area of open water in NW Hudson Bay in 2015 than either 2009 or 2011.
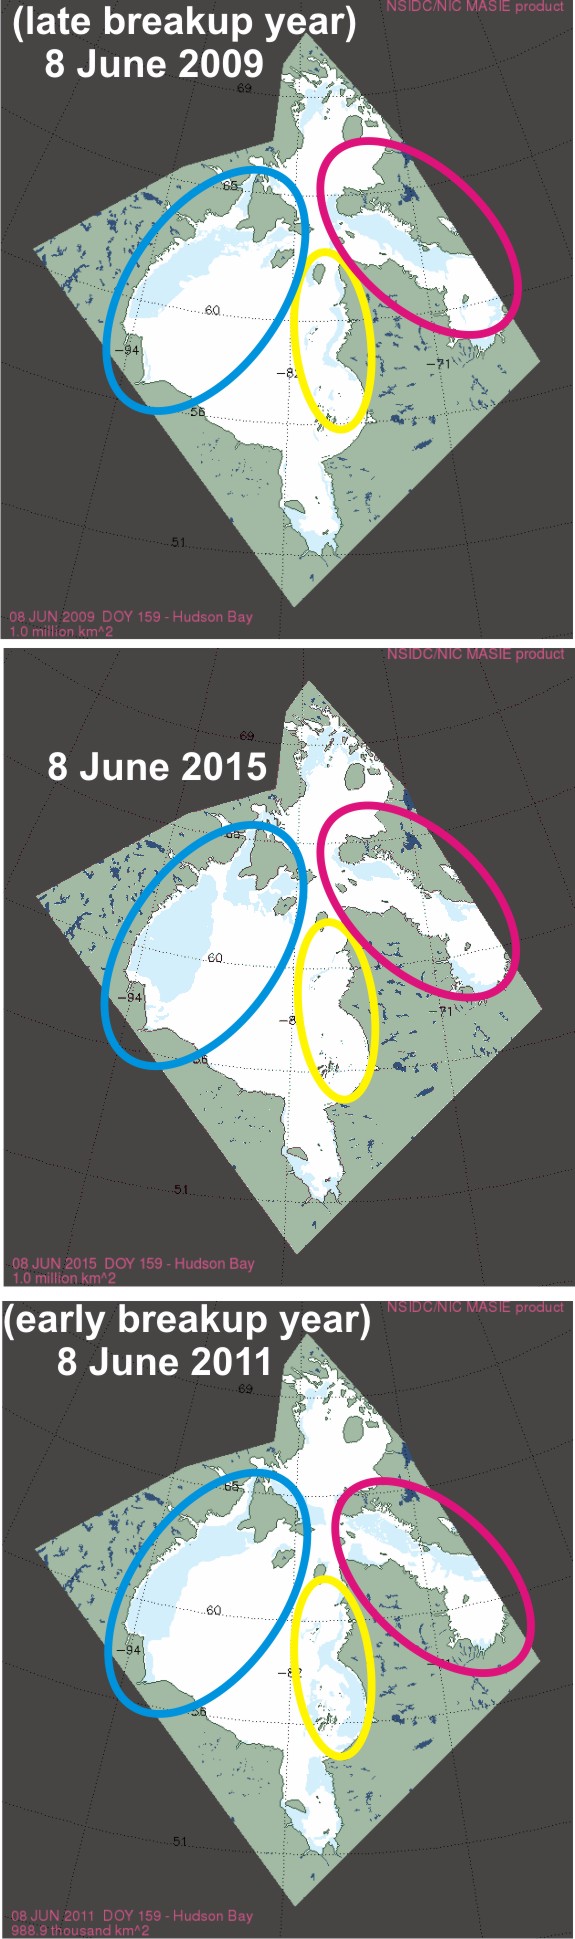
Figure 4. Sea ice coverage at 8 June 2009, 2015, 2011. Click to enlarge.
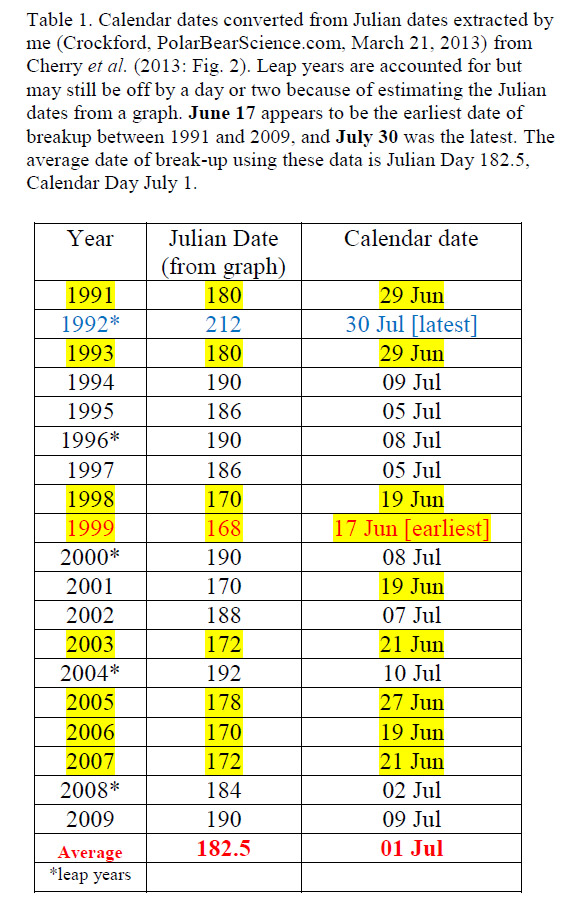
Table 1 below shows breakup dates based on Cherry et al. 2013, for breakup calculated specificially for polar bears (date when ice coverage over WHB region reaches 30%). Click to enlarge.
References
Cherry, S.G., Derocher, A.E., Thiemann, G.W., Lunn, N.J. 2013. Migration phenology and seasonal fidelity of an Arctic marine predator in relation to sea ice dynamics. Journal of Animal Ecology 82:912-921. http://onlinelibrary.wiley.com/doi/10.1111/1365-2656.12050/abstract
Lunn, N.J., Regehr, E.V., Servanty, S., Converse, S., Richardson, E. and Stirling, I. 2013. Demography and population assessment of polar bears in Western Hudson Bay, Canada. Environment Canada Research Report. 26 November 2013. PDF HERE


You must be logged in to post a comment.