
Reposted from 23 March 2016: Despite the fact that the polar bears of Southern Hudson Bay (SHB) live further south year round than any others, a recent study found their average body weight has declined relatively little since the 1980s. There has been no decline in the size of the population over that time either.
Remarkably – despite what we are told about how critical breakup dates are to polar bear health and survival in Hudson Bay – this study found that for SHB bears, the small decline in body condition index correlated only with freeze-up dates, not breakup dates or length of the ice-free season. They also found that regional breakup and freeze-up dates relevant to polar bears in this area was the day when ice cover reached 5% (not 50%).
In other words, SHB polar bears left the ice (or returned to it) when the average ice cover near the coast was about 5%. This finding is yet more evidence that the meteorological definition of “breakup” (date of 50% ice cover) used by many researchers (see discussion here) is not appropriate for describing the seasonal movements of polar bears on and off shore.
The news (two weeks after this post originally went up, see also here), however, is about the bit of weight decline, hyped to the maximum.
Is losing weight significant?
Martin Obbard and colleagues determined that in the 2000s, females on average were about 31 kg lighter than they were in 1980s and males 45 kg lighter. But the number of bears in the population did not decline over the same period (Obbard et al. 2015), which suggests that fact is not especially significant.
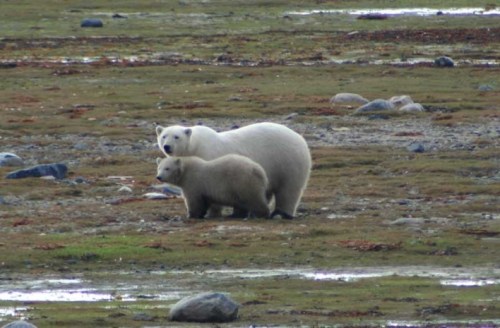
Considering that males can be over 500 kg and females over 300 kg by the time they come ashore in late summer (see photo below), it’s hard to say what affect such an average weight loss might have. Previous research (Derocher et al. 1992) – on animals captured between 1982 and 1990 – suggested that the critical weight for females was about 189 kg (below this weight, females could not maintain a pregnancy). No mention was made in this new paper about finding any mature females at or near this critical point.
Some bears probably weigh much less than they might have 30 years ago while others are only slightly lighter (or the same) – and some might be heavier. If the much lighter animals are young bears (on their own for the first time) or old animals in declining health, these bears would be just as likely to die today as they would have been 30 years ago, during years with poor ice conditions (and yes, there were years in the past when freeze-up was late in SHB – see graph below: look at 1981, 1989, 1991).
Dramatic weight loss has occurred in the past in other Hudson Bay animals, even experienced mature females. The 17 year old Western Hudson Bay female pictured below was down to only 99 kg (218 lbs) in the poor ice year of 1983 (when freeze-up was very late in WHB, after a winter with heavy snow) but had regained that weight in spectacular fashion over the following spring (Ramsay and Stirling 1988), topping the scales in July 1984 at 410 kg (910 lbs). That female wasn’t an anomaly – Derocher and colleagues (1992:563) found a WHB female that weighed about 500 kg and several that were in the 350-400 kg range (which may have included the individual below).

The Western Hudson Bay female above had three cubs-of-the year in November of 1983 and weighed only 99 kg – by the following July she had either weaned those cubs or, more probably, lost them all and was pregnant again. By July 1984, she’d recovered and weighed 410 kgs. From Ramsay and Stirling 1988:614-615).
Ramsay and Stirling (1988:615) noted that in the fall of 1983, the mean weight of pregnant females had dropped to about 216 kg, from an average of 253 kg in other years. That’s a drop of 37 kg in one year. Although it was considered statistically significant at the time, it did not approach Derocher and colleagues critical point of 189 kg.
Since Obbard and colleagues do not give any actual weights (i.e., raw data) – only a “body condition index” – it is impossible to tell whether Southern Hudson Bay polar bears are at or near this critical weight point or not. I presume not or they would have said so, since that would have been a significant finding.
As a consequence, I conclude that a finding that females were 31 kg lighter in the 2000s than they were in the 1980s is nothing to be alarmed about – even if the decline is statistically significant, it does not appear to be biologically significant.

Map of study area, from Obbard et al. 2016.
Breakup vs. Freeze-up dates
It takes only a brief look at the graph of breakup and freeze-up dates over time (that Obbard and colleagues included, see below) to see that freeze-up dates have actually changed very little since the year 2000. In fact, the latest freeze-up date in the fall occurred in 1998 – in an extreme El Nino year (day 350, about 16 December), with the next-latest dates in 1999 and 2009 (at about day 338, 4 December).
Here’s what the authors had to say about the relationship between body condition and sea ice:
“Date of freeze-up had a stronger influence on subsequent body condition than date of break-up in our study. Though models with date of freeze-up were supported over models with other ice covariates, we acknowledge that lower variability in freeze-up dates than in ice duration or break-up dates could have influenced the model selection process. Nevertheless, we suggest that a stronger effect of date of freeze-up may be because even though break-up has advanced by up to 3-4 weeks in portions of Hudson Bay it still occurs no earlier than late June or early July so does not yet interfere with opportunities to feed on neonate ringed seal pups that are born in March-April in eastern Hudson Bay (Chambellant 2010). Therefore, losing days or weeks of hunting opportunities during June and July deprives polar bears of the opportunity to feed on adult seals, but does not deprive them of the critical spring period (Watts and Hansen 1987) when they are truly hyperphagic. No doubt, the loss of hunting opportunities to kill adult seals has a negative effect on body condition, but it appears that for bears in SH a forced extension of the fast in late fall has a greater negative effect on subsequent body condition.” [my bold]
[Here is pdf conversion table of Julian days of the year to calendar dates, if you want to look up some of the dates in the graph below).
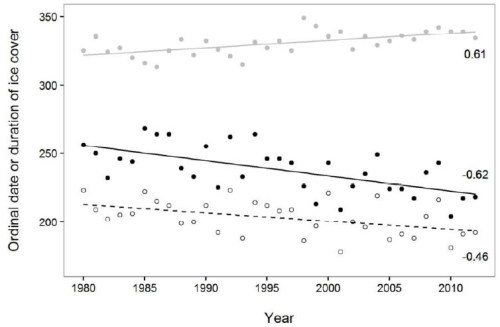
From Obbard et al. 2016, their Fig. 4: Julian day dates of freeze-up (grey dots) and breakup (hollow dots) compared to duration of ice cover (all based on 5% total ice concentration. 1980-2012. The latest freeze-up date was about day 350 in 1998 (16 December).
No mention is made in this paper of the excellent ice conditions experienced by SHB polar bears this last fall, when break-up was later than it’s been since 1992 (sometime after 10 August/day 222) and freeze-up in the south end of Hudson Bay was well underway by the end of November (see map below).
Defining breakup and freeze-up
Back in 2013, graduate student Seth Cherry published a paper that showed the most relevant definitions of breakup and freeze-up for western Hudson Bay polar bears were 30% and 10%, respectively. But these definitions have been ignored by his colleagues (see Lunn et al. 2014, 2015), almost certainly because Cherry’s analysis showed that breakup dates specifically defined for WHB bears, had not impinged upon their critical spring feeding period.
How much do you want to bet that Obbard and colleagues finding that 5% ice cover works best as a definition of both breakup and freeze-up in SHB will also be ignored by their colleagues in favour of the meteorological definitions (date of 50% ice cover)?
Take-away points
- Breakup dates over Hudson Bay have so far not impacted the critical spring feeding period for polar bears (considered by these authors to be April and May, when the bears gorge themselves on newborn seals) which is why late freeze-up years have a larger impact on polar bear weight (i.e., body condition).
- Freeze-up dates have been getting earlier since a peak in 1998 (not later). And it’s clear from past events that this population has weathered an occasional year with late freeze-up without catastrophic losses (as have others).
- The definition of breakup and freeze-up of southern Hudson Bay sea ice that’s relevant to polar bear health and survival is 5% ice cover, not 50% – because of how the ice freezes and melts in relation to the coast. Here’s a tip for journalists: if you’re interviewing a polar bear researcher about a paper that uses 50% ice cover to define breakup/freeze-up over Hudson Bay, ask them why.
References
Cherry, S.G., Derocher, A.E., Thiemann, G.W., Lunn, N.J. 2013. Migration phenology and seasonal fidelity of an Arctic marine predator in relation to sea ice dynamics. Journal of Animal Ecology 82:912-921.
Derocher, A.E., Stirling, I. and Andriashek, D. 1992. Pregnancy rates and serum progesterone levels of polar bears in western Hudson Bay. Canadian Journal of Zoology 70:561-566.
Lunn, N.J., Servanty, S., Regehr, E.V., Converse, S.J., Richardson, E. and Stirling, I. 2014. Demography and population assessment of polar bears in Western Hudson Bay, Canada. Environment Canada Research Report. July 2014. PDF HERE [This appears to be the version submitted for publication]
Lunn, N.J., Servanty, S., Regehr, E.V., Converse, S.J., Richardson, E. and Stirling, I. 2016. Demography of an apex predator at the edge of its range – impacts of changing sea ice on polar bears in Hudson Bay. Ecological Applications, in press. DOI: 10.1890/15-1256
Obbard, M.E., Stapleton, S., Middel, K.R., Thibault, I., Brodeur, V. and Jutras, C. 2015. Estimating the abundance of the Southern Hudson Bay polar bear subpopulation with aerial surveys. Polar Biology 38:1713-1725.
Obbard, M.E., Cattet, M.R.I., Howe, E.J., Middel, K.R., Newton, E.J., Kolenosky, G.B., Abraham, K.F. and Greenwood, C.J. 2016. Trends in body condition in polar bears (Ursus maritimus) from the Southern Hudson Bay subpopulation in relation to changes in sea ice. Arctic Science, in press. 10.1139/AS-2015-0027
Ramsay, M.A. and Stirling, I. 1988. Reproductive biology and ecology of female polar bears (Ursus maritimus). Journal of Zoology London 214:601-624.
http://onlinelibrary.wiley.com/doi/10.1111/j.1469-7998.1988.tb03762.x/abstract


You must be logged in to post a comment.