Tag Archives: minimum ice extent

No correlation between freeze-up dates for Hudson Bay & total Arctic ice cover

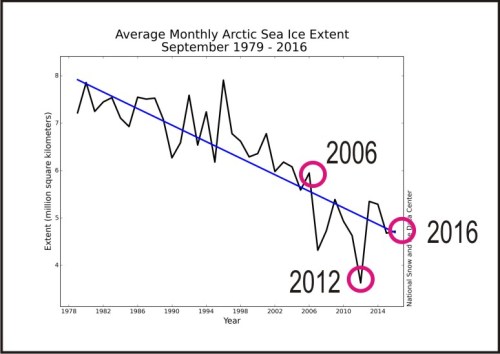
Guess which year between 2006 and 2016 had the latest start to freeze-up on Hudson Bay, given that 2012 had the lowest September average and 2007 and 2016 tied for second-lowest (see graph below, from NSIDC), and that sea ice in the Arctic right now is the lowest it’s been for this date since 1979?

sea-ice-sept-averages-graph-only-marked-for-2006-up

If you guessed anything other than 2010, you guessed wrong – in addition, 2006 (not 2016) was second latest.

There is no correlation between Arctic sea ice coverage and freeze-up dates for Western Hudson Bay.

Yet, Polar Bears International (“Save Our Sea Ice”) –  who were surely in and around Churchill in 2010 and 2006 watching polar bears – just posted an alarming statement about local conditions, implying that slow freeze-up of Hudson Bay this year is a reflection of the fact that “sea ice is at a record low across the Arctic.”

They also claim that “…the weather is the warmest we’ve ever seen at this time of year.” That may be true, but if so, it is also meaningless with respect to the progress of freeze-up.

Does no one at PBI remember the very late freeze-up of 2010 or 2006? Odd, that.

Continue reading

Walrus and sea ice, a summary

I’ve written a briefing paper for the GWPF refuting claims that huge herds of Pacific walruses hauled out on land are a sign of global warming.

Here’s the GWPF press release:

London, 20 October: A briefing paper published today by the Global Warming Policy Foundation refutes claims that Arctic walruses are in distress and danger due to global warming.

The paper, written by Canadian zoologist Dr Susan Crockford, assesses the recent mass haulouts of walrus females and calves on the beaches of Alaska and Russia bordering the Chukchi Sea. The events have been blamed by US government biologists and WWF activists on lack of summer sea ice, amplified into alarming scare stories by news media around the world.

Such claims ignore previous haulouts that suggest a different cause. Scientific reports about large walrus haulouts that have occurred repeatedly over the last 45 years show that they are not new phenomena for this region.

At least two documented incidents of similar magnitude have occurred in the recent past: one in 1978, on eastern St. Lawrence Island and the other in 1972, on the western end of Wrangel Island. The 1978 event involved an estimated total of almost 150,000 walrus hauled out within in a small geographic area.

Moreover, sea ice maps for the months when known mass haulouts occurred, compared to years when they did not, suggest no strong correlation with low sea ice levels.

“The WWF and American walrus biologists have categorically linked the Point Lay mass haulout event to global warming, but available evidence suggests that’s alarmist nonsense,” Dr Crockford said.

“Blaming lack of sea ice for recent events ignores the documented factor – large population size – that drove walruses onto beaches en masse in the past, when plenty of ice was available. Conservation measures have almost certainly led to a spectacular recovery of walrus numbers over the last few years. This suggests that recent mass haulouts are more an indicator that Chukchi walrus are nearing maximum capacity than a sign of impending global warming catastrophe,” Dr Crockford added.

Here’s the paper. [Link fixed, h/t HO]

Save

Ian Stirling now says the polar bear that “died of climate change” last year was “in his prime”

With Barents Sea ice way above average this summer, Polar Bear Specialist Group biologist Ian Stirling now claims the old polar bear that he said died of climate change last year on Svalbard was “in his prime” and still blames the bear’s death on lack of sea ice — despite all evidence to the contrary.

UPDATE Sept. 19, 2014 typo fixed in Fig. 1 caption [sea ice low for 2012 was 3.41 m2km, not 4.1, see here.]

Figure 1. The National Snow and Ice Data Center (NSIDC) says the September minimum for 2014 is “imminent” and suggests the low may come in at 5.1 million square kilometers (far short of the 4.1 m2km low reached in 2012. About the much larger than average amount of ice around Svalbard and Franz Josef Land, they said only: “As was the case for the beginning of the month, extent remains below average in all sectors of the Arctic except for a region in the Barents Sea, east of Svalbard.”

Figure 1. The National Snow and Ice Data Center (NSIDC) says the September minimum for 2014 is “imminent” and suggests the low may come in at 5.1 million square kilometers (far short of the 4.1 3.41 m2km low reached in 2012. About the much larger than average amount of ice around Svalbard and Franz Josef Land, they said only: “As was the case for the beginning of the month, extent remains below average in all sectors of the Arctic except for a region in the Barents Sea, east of Svalbard.”

Continue reading