
The 2016 Scientific Working Group report on Baffin Bay and Kane Basin polar bears was released online without fanfare last week, confirming what local Inuit have been saying for years: contrary to the assertions of Polar Bear Specialist Group scientists, Baffin Bay and Kane Basin subpopulations have not been declining but are stable.
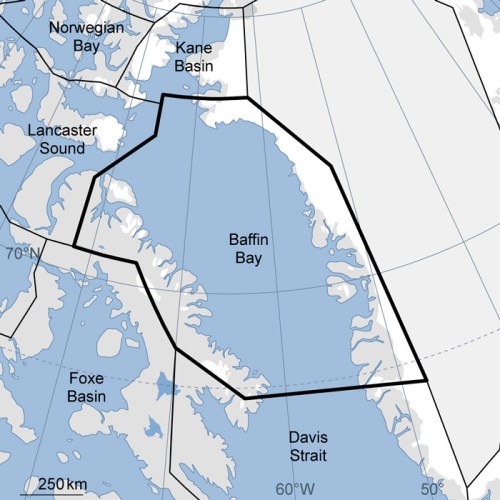
Until recently, the Baffin Bay (BB) and Kane Basin (KB) polar bear subpopulations, that live between NW Greenland, and Baffin and Ellesmere Islands, were assessed with confidence by the IUCN Polar Bear Specialist Group (PBSG) to be declining due to suspected over-hunting (see 2016 Report, Ch. 1, pg. 4).
It turns out they were wrong.
New (2016) polar bear subpopulation estimates for BB and KB:
Baffin Bay – 2,826 (95% CI = 2,059-3,593) at 2013
[vs. 1546 (95% CI = 690-2,402) expected 2004]
vs. 2,074 (95% CI = 1,553-2,595) in 1997
Kane Basin – 357 (95% CI: 221 – 493) at 2013
vs. 164 (95% CI: 94 – 234) in 1997
[1997 figures from 2015 IUCN Red List estimates, from Supplement, pg. 8); 2004 “expected” figure for Baffin Bay from 2016 SWG report, Ch. 1, pg. 4]
In 2014, Environment Canada’s assessments were ‘data deficient’ for Kane Basin and ‘likely declining’ for Baffin Bay (see map below):
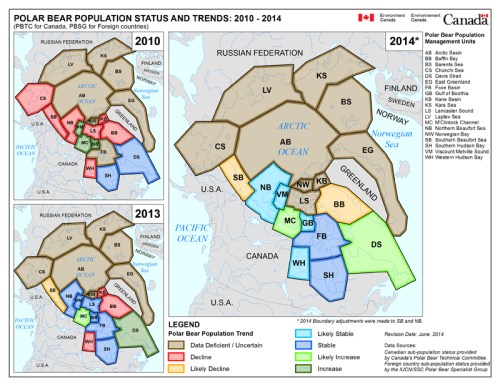
However, the results of this new study (conducted 2011-2013) would likely make KB in the map above dark blue (‘stable’), and BB light blue (‘likely stable’), depending on how the new information is interpreted (given differences in methodology between the 1991-1997 and 2011-2013 counts). Note that a recent paper by Jordan York, Mitch Taylor and others (York et al. 2016) suggested this outcome for Baffin Bay was likely (i.e. ‘stable’) but thought that the status of Kane Basin would remain ‘declining.’
This new information leaves only the Southern Beaufort subpopulation (SB) in a ‘likely declining’ condition, but since that decline was due to thick spring ice conditions in 2004-2006 (Crockford 2017), it does not reflect a response to recent loss of summer sea ice. The new population estimates for Baffin Bay and Kane Basin also suggests that a revision needs to be made to the 2015 IUCN Red List assessment with respect to the global population estimate because polar bears are clearly more abundant in Baffin Bay and Kane Basin than previously thought.
The new BB and KB subpopulation estimates should increase the 2015 global population size estimate issued in 2015 by the IUCN Red List from 22,000-31,000 to 22,633-32,257 which would likely be rounded off to 22,500-32,000. But wait! That estimate does not include a reported 42% increase in the Svalbard portion of the Barents Sea subpopulation in late 2015 (975 bears counted, up 290 over the 2004 count of 685) that was not included in the Red List assessment of 2644 (95% CI: 1,899 – 3,592) based on 2004 data. Therefore, when the Svalbard increase and the Baffin Bay/Kane Basin increases are all added to the 2015 Red List estimate, it might give a revised 2015 global estimate of something like 23,000-33,000 depending on how all the results are interpreted.
Given that these three surveys were known to have been completed (or were planned to be done) at the time the latest Red List assessment was being compiled, it seems very odd it was not simply postponed until the new data could be included. But perhaps an update will be forthcoming before the next formal assessment takes place.
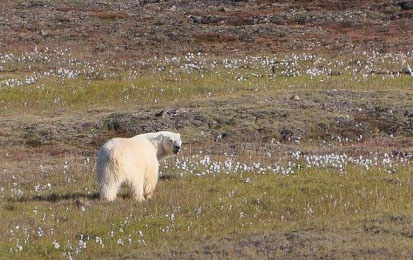
A polar bear in the summer of 2012 near Thule, NW Greenland (part of the Baffin Bay subpopulation). Note the decidedly chubby back end on this bear, who looks well prepared for winter. Photo by Robin Davies. [details at my Quote Archive, Featured Quote #6]
The report Summary is a separate stand-alone file, with discrete pagination, see the pdf here. I may have more to say about this in a few days but for now, the status change and population size estimates are the most noteworthy.
Summary, pg. 13-14 [Kane Basin subpopulation size & status] – my bold:
“The estimated abundance of the KB subpopulation was 357 polar bears (95% CI: 221 – 493) for 2013 – 2014. A re-calculation of the 1990s data provided an estimate of 224 bears (95% CI: 145 – 303) for the period 1995 – 1997. Based on physical MR, the size of the KB subpopulation was previously estimated to be 164 polar bears (95% CI: 94-234) for 1994-1997 (noting that this estimate applies to different years than our re-analysis; Taylor et al. 2008).
…
Based on a randomization procedure that assumed normal sampling distributions for abundance estimates, the mean difference between the estimate of KB abundance for 2013-2014 and the estimate for 1995-1997 was approximately 133 bears (standard deviation of the difference ≈ 80 bears), with 95% of the sampling distribution suggesting that population change between the two time periods could have been positive. This suggests relatively strong evidence for a stable to increasing subpopulation, and is consistent with data on movements, condition and reproduction.
These changes suggest the subpopulation is currently healthy and stable.
…
We documented a reduction in mortality associated with harvest, likely attributable to implementation of Greenland’s harvest quota in 2006.”
Summary, pg. 21 [Baffin Bay subpopulation size & status] – my bold:
“The genetic mark-recapture assessment of the BB subpopulation resulted in a mean estimate (2012-2013) of total abundance of 2,826 polar bears (95% CI = 2,059-3,593). Due to several limitations of the available data, discussed in detail in this report, the estimates of abundance for the 1990s and 2000s are not directly comparable. Therefore, it is not possible to draw firm conclusions about trends in the abundance of the BB subpopulation. Nevertheless, the study has demonstrated the presence of a subpopulation in Baffin Bay considerably larger than that inferred from previous modeling (1,546 bears cf. PBSG 2015); the results of which formed part of the basis for the PBSG’s (2015) designation of BB as a declining subpopulation. TEK information has not indicated any marked decline in the BB subpopulation (e.g. Dowsley and Taylor 2006, Born et al. 2011).”
References
Crockford, S.J. 2017. Testing the hypothesis that routine sea ice coverage of 3-5 mkm2 results in a greater than 30% decline in population size of polar bears (Ursus maritimus). PeerJ Preprints 19 January 2017. Doi: 10.7287/peerj.preprints.2737v1 Open access. https://peerj.com/preprints/2737/
SWG [Scientific Working Group to the Canada-Greenland Joint Commission on Polar Bear]. 2016. Re-Assessment of the Baffin Bay and Kane Basin Polar Bear Subpopulations: Final Report to the Canada-Greenland Joint Commission on Polar Bear. +636 pp. http://www.gov.nu.ca/documents-publications/349
York, J., Dowsley, M., Cornwell, A., Kuc, M. and Taylor, M. 2016. Demographic and traditional knowledge perspectives on the current status of Canadian polar bear subpopulations. Ecology and Evolution 6(9):2897-2924. DOI: 10.1002/ece3.2030


You must be logged in to post a comment.