
It’s been more than a year since I first published my scientific manuscript at PeerJ Preprints (a legitimate scientific forum) on the failure of Amstrup’s 2007 USGS polar bear survival model (Crockford 2017), a year waiting in vain for the polar bear community to comment. They either couldn’t be bothered or knew they couldn’t refute it – I haven’t known for sure which. But I do now.
Polar bear specialists didn’t comment because they couldn’t refute it in the scholarly manner required by PeerJ: all they could do is tear it down with derision, misdirection and strawman arguments.
I know this because the damage control team for the polar-bears-are-all-going-to-die-unless-we-stop-using-fossil-fuels message wasn’t activated over my fully-referenced State of the Polar Bear Report for 2017 (Crockford 2018) released on International Polar Bear Day last month, but for a widely-read opinion piece I’d written for the Financial Post published the same day (based on the Report) that generated three follow-up radio interviews.
By choosing to respond to my op-ed rather than the Report or my 2017 paper, biologists Andrew Derocher and Steven Amstrup, on behalf of their polar bear specialist colleagues1, display a perverse desire to control the public narrative rather than ensure sound science prevails. Their scientifically weak “analysis” of my op-ed (2 March 2018), published by Climate Feedback (self-proclaimed “fact checkers”), attempts damage control for their message and makes attacks on my integrity. However, a scientific refutation of the premise of my 2017 paper, or The State of the Polar Bear Report 2017, it is not (Crockford 2017, 2018).
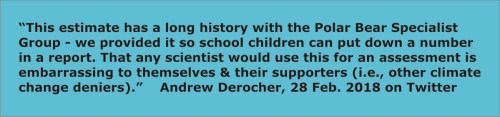
Derocher further embarrasses himself by repeating the ridiculous claim that global polar bear population estimates were never meant for scientific use, then reiterates the message with added emphasis on twitter:
Just as the badly written Harvey et al. (2017) Bioscience paper said more about the naked desperation of the authors than it did about me or my fellow bloggers, this attempt by the polar bear community’s loudest bulldogs to discredit me and my work reveals their frustration at being unable to refute my scientifically supported conclusion that Amstrup’s 2007 polar bear survival model has failed miserably (Crockford 2017).
Part 1 of my detailed, fully referenced responses to their “analysis” of my op-ed are below. Part 2 to follow [here].
Quote #1 from my op-ed to which Amstrup & Derocher responded:
“Although the extent of the summer sea ice after 2006 dropped abruptly to levels not expected until 2050, the predicted 67-per-cent decline in polar bear numbers simply didn’t happen. Rather, global polar bear numbers have been stable or slightly improved.”
Amstrup responded, in part:
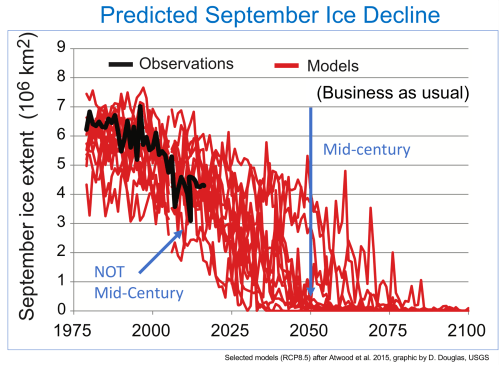
“Of course summer ice availability has been reduced from earlier years, but neither observations nor models suggest that what we predicted for mid century has already happened. Here is an image that may help put this in perspective, and make it clear why our projections focused on mid century and beyond, and that we are not yet in mid-century.”
My response to Amstrup’s comment:
The “image” Amstrup offers as evidence is a sea ice projection graph, shown below, modified from Atwood et al. 2015. This is a strawman argument: a sea ice projection from 2015 is irrelevant to models used in 2007. The ESA decision of 2008 (USFWS 2008) used the 2007 USGS reports Amstrup co-authored with colleagues based on sea ice projections developed in 2005/2006 for 2007 IPCC AR4 (e.g. Holland et al. 2006; Soloman et al. 2007; Zhang and Walsh 2006) not models developed later.2
The appropriate sea ice image to discuss is this one (especially the panel on the left), found in Amstrup et al. (2007:84); Durner et al. (2007:46); Durner et al. (2009:44):
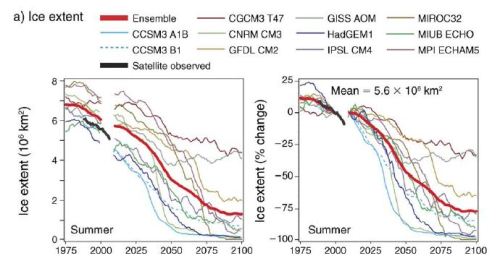
This version is taken from Durner et al. (2009:44, Fig. 9). From the original caption: (a) Mean monthly ice extent in the full study area during the summer ice seasons (left column) and expressed as percentage change (right column) relative to the respective model’s 1990–1999 mean for the 20th-century hindcasts and the satellite-observed record and the 2001–2010 mean for the 21st-century GCM projections. Mean monthly values of ice extent (panel a, right column) during 1990–1999 from the satellite observed record are shown in the ice-extent percentage-change panels to provide a baseline for assessing the effective magnitude of change. All results are plotted as 10-year running means.
Derocher responded, in part, with two discrete statements:
“This is nonsense. No polar bear scientist has predicted a drop in polar bear abundance based on summer sea ice. We base the assessment of loss on duration of the ice-free period.”
My response to Derocher’s first comment:
It is certainly true that the complex models developed by Amstrup and colleagues in 2007 used multiple aspects of sea ice called ‘optimum polar bear habitat,’ but when it came down to explaining the results, ‘summer’ was the term used in all the papers. Durner et al. (2007:10) state explicitly that “summer” was August and September and that the average length of this period was not predicted to change over the 21st century, making the extent for September (otherwise known as the summer minimum) a critical metric.
Which means that in 2007, it was not the “duration” of the ice-free period in summer that was considered critical but the threshold of September extent.
There is, for example, this clear statement in the Executive Summary (USGS 2007) that equates critical levels of “optimal polar bear habitat” with the season known as “summer”:
“12. Ultimately, we projected a 42% loss of optimal polar bear habitat during summer in the polar basin by mid century.”
The use of “summer” ice extent (the September average) as a proxy for critical levels of optimal polar bear habitat is also evident in the Durner et al. (2009:44) Fig. 9 (shown above), which shows sea ice extent projections for summer to the end of the 21st century.
In addition, Amstrup et al. (2007: 34-35) included this graphic, showing sea ice extent at 23 August 2007 (near the end of the summer melt season) compared to their predictions for mid-century (2045-2054), emphasizing that ice coverage had by that date declined below the level projected for mid-century:
“As of 23 August 2007 declines in Arctic sea ice extent in 2007 have set a new record for the available time series from 1979-2006. …Because this new record has occurred 25-83 days before the summer melt season will end in different parts of the polar basin (Stroeve et al. 2006), much more melting and greater sea ice reduction seems likely. … But, the sea ice in 2007 already has declined below the level projected for mid century by the 4 most conservative models in our ensemble (Figure 15).”

The figure above from Amstrup et al. (2007) was subsequently updated to show the summer minimum at 16 September 2007 in Amstrup et al. (2008: plate 8), again emphasizing that ice coverage at the September minimum (the summer seasonal low) had already declined below the level projected for mid-century by half of the models they used:
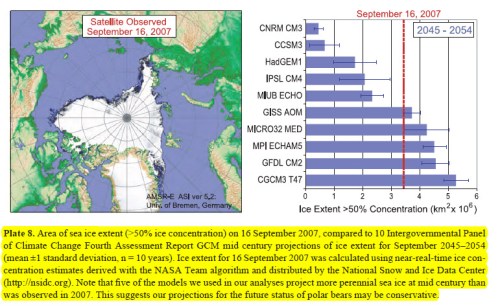
Durner et al.’s (2007:16) description of this mid-century threshold for summer sea ice is explicit:
“By the mid-21st century, most peripheral seas [of the Arctic Ocean, e.g. Southern Beaufort, Chukchi, Laptev, Barents, and Kara Seas] have very little remaining optimal polar bear habitat during summer.”
The “peripheral seas” phrase used by Durner et al. comprise 6 of the 19 polar bear subpopulations and are classified as ‘Divergent’ sea ice ecoregions in the map below, which have been close to ice-free in summer since 2007 (Crockfor 2017). Polar bear populations in Divergent and Seasonal ecoregions were predicted to drop to zero when sea ice declined to mid-century levels, leaving little remaining habitat during summer:
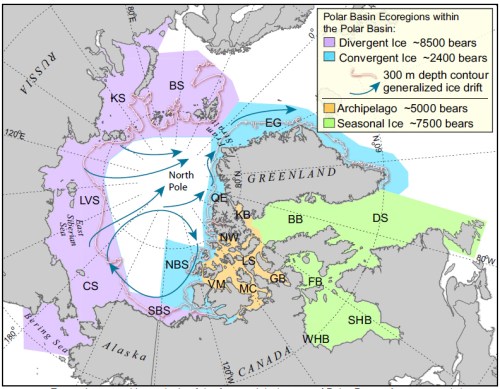
This sea ice ecoregion map (Amstrup 2011:13) shows the Arctic Basin (in white, not labeled, around the North Pole) and includes broad population estimates per ecoregion (total 23,400) that differ from those used in Amstrup et al. (2007: Table 6; total 24,500).
[Notice that the sea ice ecoregion map provided by Amstrup (2011), shown above, includes some broad population estimates per ecoregion (which actually don’t add up to the total of 24,500 used in Amstrup et al. 2007). These ecoregion estimates are pertinent to Dercoher’s second claim, addressed below.]
These examples show that average sea ice levels for September (also called ‘summer’) were used by the authors of the USGS reports as a proxy for optimal polar bear habitat at its lowest level, for both the baseline period and the future. Therefore, September ice extent is a valid proxy for evaluating the validity of the prediction that 2/3 of the world’s polar bears would disappear when sea ice consistently dropped to levels predicted for mid-century (i.e. 2045-2054).
Derocher’s second response to quote #1:
“The statement about global polar bear numbers is absolutely unfounded. It is a contrived statement using population estimates provided so that children (or the general public) could give a number of polar bears in the world for school reports and the like.”
My response to Derocher’s second comment:
Off the top of my head, I count at least four polar bear specialist papers or reports that use global population estimates and/or subpopulation estimates in their assessments of present or modeled polar bear health and survival.
See map above from Amstrup 2011, which includes population estimates for the four sea ice ecoregions used to assess polar bear health and survival in 2007, used to support the US Fish and Wildlife decision to classify polar bears as ‘threatened’ on the Endangered Species List in 2008. Amstrup et al. (2007: Table 6) used not only the global population total (24,500) but ecoregion totals in their model predicting polar bear surivival over the 21st century.
Wiig et al. (2015) is the document supporting the 2015 IUCN Red List assessment for polar bears as ‘vulnerable’ to extinction and their Supplementary document (pdf here) included a table of the subpopulation estimates (Table 3, total 26,485) that were used in their model of predicted polar bear decline based on predicted habitat loss, with no mention that these were “contrived.” In fact, the IUCN insisted such estimates be used (see Minutes of the 17th meeting of the IUCN Polar Bear Specialist Group 2014: 16, pdf here).
Regehr et al. 2016 is the peer-reviewed version of Wiig et al. (2015) and the authors state in their introduction: “The global population of approximately 26 000 polar bears is divided into 19 subpopulations.” There is no mention that this number is “contrived” or otherwise considered unscientific.
Have these researchers forgotten that the 1973 international treaty that spawned the formation of the IUCN Polar Bear Specialist Group (PBSG) was tasked not just with coordinating the research necessary for assessing polar bear health but with establishing a global population size (Anonymous 1968)?
It is clear that polar bear specialists use global and subpopulation estimates for modeling purposes upon which assessments are based when it suits them, even if at other times they claim these are scientifically invalid. PBSG Chair Dag Vongraven made a statement similar to Derocher’s back in 2014, which didn’t go over well with the public (“The Politics of Polar Bears”). But I’m glad Derocher included this point in his comment, as it backs up the same preposterous claim he made on twitter 28 February 2018 that went even further:
https://twitter.com/AEDerocher/status/968943242220789760
Concluding comments regarding Quote #1:
Trying to refute my critique of Amstrup et al.’s 2007 model with polar bear survival or sea ice predictions published later is a worthless, strawman ploy. Both Amstrup and Derocher pull this stunt but none of the papers they cite (i.e., Castro de la Guardia 2013; Amstrup et al. 2010; Regehr et al. 2016; Atwood et al. 2015) are relevant to my conclusion that the model developed by Amstrup et al. (2007) has been shown to have failed by recent observational evidence (Crockford 2017, 2018).
Amstrup et al. (2007) and Durner et al. (2007) both use average sea ice levels for September (also called ‘summer’) as a proxy for optimal polar bear habitat at its lowest extent, which means it is valid to use that metric to access the veracity of the model.
Finally, documents show that polar bear specialists use global and subpopulation estimates in scientific assessments when it suits them (e.g. Amstrup 2011; Amstrup et al. 2007; Regher et al. 2016; Wiig et al. 2015), and deny these estimates are scientifically valid when anyone else draws attention to the fact these numbers are increasing rather than decreasing as predicted. That’s spin, not science.
Part 2 will address the other four quotes which Derocher and Amstrup addressed. Find it here.
Footnote 1: Apparently, “Climate Feedback” claim critiques of my Financial Post op-ed from three polar bear specialists but they really only provide two. The third commenter gave only his overall opinion but clearly did not have the depth of knowledge about polar bears to comment in detail about the specific issues raised, which suggests he did not have the depth of knowledge to comment at all. Cody Dey is a post-doc researcher who finished his Ph.D. on another topic and is spending a year or so working on polar bears. I wonder if Climate Feedback simply did not bother to ask another, more knowledgeable polar bear specialist (like Ian Stirling, perhaps) for their opinion or if none were willing to respond?
Footnote 2: Amstrup says the graph he provides is modified from “Atwood et al. 2015.” However, there appears to be only one publication that fits that citation (details provided below) and the sea ice graph it contains, on pg. 39, is an anomaly graph (showing amount of change, not absolute extent). Consequently, it does not look anything like the graph provided by Amstrup, even without the snarky labels.
References
Amstrup, S.C. 2011. Polar bears and climate change: certainties, uncertainties, and hope in a warming world. In: R.T.Watson, T.J. Cade, M. Fuller, G. Hunt and E. Potapov (eds.), Gyrfalcons and Ptarmigan in a Changing World, Volume 1. The Peregrine Fund, Boise, Idaho.
Amstrup, S.C., Marcot, B.G. & Douglas, D.C. 2007. Forecasting the rangewide status of polar bears at selected times in the 21st century. US Geological Survey. Reston, VA. Pdf here
Amstrup, S.C., Marcot, B.G., Douglas, D.C. 2008. A Bayesian network modeling approach to forecasting the 21st century worldwide status of polar bears. Pgs. 213-268 in Arctic Sea Ice Decline: Observations, Projections, Mechanisms, and Implications, E.T. DeWeaver, C.M. Bitz, and L.B. Tremblay (eds.). Geophysical Monograph 180. American Geophysical Union, Washington, D.C. http://onlinelibrary.wiley.com/doi/10.1029/180GM14/summary and http://alaska.usgs.gov/science/biology/polar_bears/pubs.html
Amstrup, S.C., DeWeaver, E.T., Douglas, D.C., Marcot, B.G., Durner, G.M., Bitz, C.M. and Bailey, D.A. 2010. Greenhouse gas mitigation can reduce sea-ice loss and increase polar bear persistence. Nature 468: 955–958.
Anonymous. 1968. Proceedings of the First International Scientific Meeting on the Polar Bear, 6-10 September 1965 at Fairbanks, Alaska. U.S. Dept. of the Interior (Resource Publication 16) and the University of Alaska (International Conference Proceedings Series, No. 1). Available from http://pbsg.npolar.no/en/meetings/ [accessed June 27, 2014]
Atwood, T.C., Marcot, B.G., Douglas,D.C., Amstrup, S.C., Rode, K.D., Durner, G.M. and Bromaghin, J.F. 2015. Evaluating and ranking threats to the long-term persistence of polar bears. USGS Open-File Report 2014–1254. Pdf here.
Castro de la Guardia, L., Derocher, A.E., Myers, P.G., Terwisscha van Scheltinga, A.D. and Lunn, N.J. 2013. Future sea ice conditions in western Hudson Bay and consequences for polar bears in the 21st century. Global Change Biology 19:2675-2687.
Crockford, S.J. 2017. Testing the hypothesis that routine sea ice coverage of 3-5 mkm2 results in a greater than 30% decline in population size of polar bears (Ursus maritimus). PeerJ Preprints 2 March 2017. Doi: 10.7287/peerj.preprints.2737v3 Open access. https://doi.org/10.7287/peerj.preprints.2737v3
Crockford, S.J. 2018. State of the Polar Bear Report 2017. Global Warming Policy Foundation Report #29. London.
Durner, G.M., Douglas, D.C., Nielson, R.M., Amstrup, S.C. and McDonald, T.L. 2007. Predicting 21st-century polar bear habitat distribution from global climate models. US Geological Survey. Reston, Virginia. Pdf here.
Durner, G.M., Douglas, D.C., Nielson, R.M., Amstrup, S.C., McDonald, T.L. and 12 others. 2009. Predicting 21st-century polar bear habitat distribution from global climate models. Ecological Monographs 79:25-58. http://www.esajournals.org/doi/abs/10.1890/07-2089.1
Harvey, J.A., van den Berg, D., Ellers, J., Kampen, R., Crowther, T.W., Roessingh, P., Verheggen, B., Nuijten, R. J. M., Post, E., Lewandowsky, S., Stirling, I., Balgopal, M., Amstrup, S.C., and Mann, M.E. 2017. Internet blogs, polar bears, and climate-change denial by proxy. Bioscience. DOI: 10.1093/biosci/bix133 pdf here. Supplementary info here.
Holland, M.M., C.M. Bitz, and B. Tremblay. 2006. Future reductions in the summer Arctic sea ice. Geophysical Research Letters. 33:L23503. Open access, pdf here.
Regehr, E.V., Laidre, K.L, Akçakaya, H.R., Amstrup, S.C., Atwood, T.C., Lunn, N.J., Obbard, M., Stern, H., Thiemann, G.W., & Wiig, Ø. 2016. Conservation status of polar bears (Ursus maritimus) in relation to projected sea-ice declines. Biology Letters 12: 20160556. http://rsbl.royalsocietypublishing.org/content/12/12/20160556
Solomon, S., D. Qin, M. Manning, Z. Chen, M. Marquis, K.B. Averyt, M. Tignor, and H.L. Miller (Editors). 2007. Summary for policymakers. In Climate Change 2007: The Physical Science Basis. Contribution of Working Group I to the 4th Assessment Report of the Intergovernmental Panel on Climate Change (IPCC). Cambridge University Press, United Kingdom. Available at https://www.ipcc.ch/publications_and_data/ar4/wg1/en/spm.html Pdf here.
Wiig, Ø., Amstrup, S., Atwood, T., Laidre, K., Lunn, N., Obbard, M., Regehr, E. & Thiemann, G. 2015. Ursus maritimus. The IUCN Red List of Threatened Species 2015: e.T22823A14871490. http://www.iucnredlist.org/details/22823/0
Zhang, X. & Walsh, J.E. 2006. Toward a Seasonally Ice-Covered Arctic Ocean: Scenarios from 991 the IPCC AR4 Model Simulations. Journal of Climate 19: 1730-1747. https://doi.org/10.1175/JCLI3767.1 Open access, pdf here.


You must be logged in to post a comment.