
Here is a look at what polar bear habitat looks like this year at the end of May compared to previous years. It helps put any predictions of impending doom into perspective.
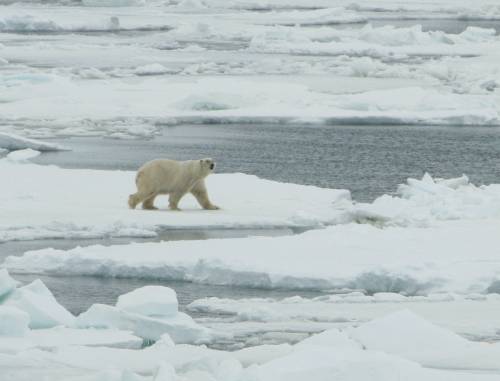
This is the time year when declining sea ice gets some people all worked up. However, declining ice is normal at this time of year and there is always variation in where the most open water appears first. At this time of year, there isn’t much ice ‘melt’ going on. Rather, what we are seeing is the opening up of shore leads and polynyas by winds.
Sea ice in Canada at 31 May
This year, as usual, open water increases with the expansion of persistent polynyas due to winds and currents. These areas increase the extent of ice edges and provide polar bears with more hunting habitat (because seals congregate near open water). This year, there is less open water in Hudson Bay than there has been in years at end of May:
Most similar recent year was 2016 for open water in the Beaufort Sea, although Hudson Bay is opening up much more slowly:

Compare to other recent years including 2018, 2017, 2015:
Chart for 2017 is for 29 May (31 not available):
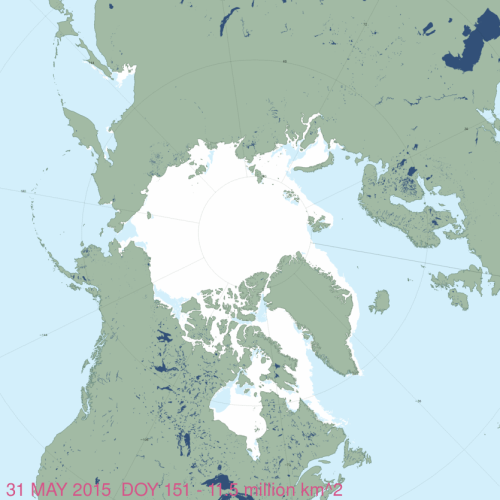
Ice loss in Hudson Bay at the end of May was most pronounced in 2015:
Sea ice globally at 30/31 May (MAISE archive)

2016 (below) was very similar to this year in total extent (11.0 mkm2) but the distribution was a bit different:

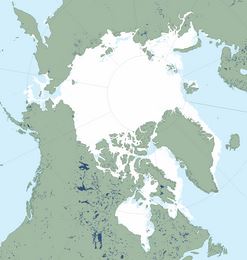
Back in 2006 (below), sea ice extent at this date was higher but not by much (11.5 mkm2), see close up here:
2015 (below) was about the same as 2006 but with less ice in Hudson Bay and more in the Chukchi Sea:


You must be logged in to post a comment.