
The report on the latest population estimate for harp seals off the east coast of North America was released in late March without fanfare and therefore no media attention. This was one of the missing scientific reports mentioned in my State of the Polar Bear Report 2019 released in February (Crockford 2020): results of surveys promised for months or years by early 2020 but not delivered.
Not surprisingly then, we find the report has good news: the population estimate of harp seals in the NW Atlantic has risen to about 7.6 million (range 6.55-8.82) animals (DFO 2020), up from 7.4 million in 2014 (DFO 2014).
Note that the survey was done in March 2017, a low ice year for the Gulf of St. Lawrence (see discussion below) and while this may have resulted in some increased mortality for pups born there, it is also known that many ‘Gulf’ pregnant females will instead have given birth off Newfoundland and Labrador in a whelping region called ‘The Front’. Apparently, these factors were accounted for in the population model.
Harp seal pups born at the Front are an important food for Davis Strait polar bears. This increase in the prey base for Davis Strait polar bears suggests the bear population may have grown substantially since the last survey in 2007 (Peacock et al. 2013; Rode et al. 2012). Davis Strai is the only subpopulation of polar bears officially considered to have ‘likely increased’ at 2018 by Environment Canada. A new Davis Strait population size survey was apparently completed in 2018 but the results are not yet available (Crockford 2020).
Highlights, quotes, and figures from the harp seal report below.
Ice conditions in March 2017
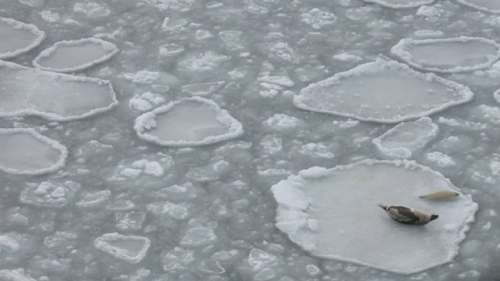
As you can see below, at 24 March 2017 when harp seal pups in the Gulf of St. Lawrence would have been about 1 week old and their mothers still with them most of the time nursing and a likely time for a survey. There was little preferred ice (thin first year ice, ca. 50cm thick, light green) around Prince Edward Island in the south and towards the Strait of Belle Isle in the north and none around the Magdalen Islands in the centre where pupping is usually concentrated:
A good ice year (2015) in the Gulf, same date in March, had much more suitable whelping habitat for harp seals, including around the Magdalen Islands (see below), and there was also abundant ice at the Front:
In contrast, there was ample suitable ice for whelping harp seals at the end of March at the Front in 2017, although there have been better years than this. Oddly enough, 2017 was the year that southern Labrador and northern Newfoundland were ‘crawling with polar bears‘ from early April and by the end of April, the ice off Newfoundland was the thickest it had been since 2007.
QUOTES FROM THE REPORT [my bold]:

Highlights
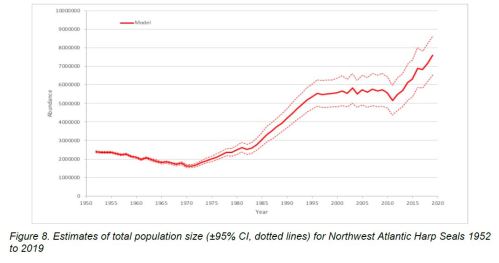
-The model indicates that the population increased from the 1970s until the mid-1990s. Between the mid-1990s and 2011 the population was relatively stable. Since then it is estimated that the population has begun to increase likely due to reductions in the removals and high reproductive rates [Figure 8, below].
-The model estimated pup production in 2019 is 1.4 (95% CI, 1.23-1.49) million and a total population size of 7.6 (95% CI, 6.55-8.82) million.
Assessment
The number of Harp Seal pups born in a year is estimated periodically from surveys flown in the spring when the seals gather on the ice to have their pups. Estimates of total population size are based on a population model that fits to estimates of pup production and reproductive rates and incorporates information on annual catches in Canada and Greenland, by-catch, struck and lost, and unusual pup mortality due to poor ice conditions. A long-term environmental index is used to indicate changes in the environment that impact reproductive rates and juvenile survival.
Photographic and visual aerial surveys were flown in the Gulf of St. Lawrence, and off Newfoundland, to determine Harp Seal pup production during March 2017. Estimated pup production in the southern Gulf was 18,300 (95% CI, 15,400-21,200) seals; 13,600 (95% CI, 7,700-19,500) in the northern Gulf and 714,600 (95% CI, 538,800-890,400) at the Front, for a total estimated pup production in 2017 of 746,500 (95% CI, 570,300-922,700) (Table 2). This estimate is approximately one half of the number of pups estimated in 2008, but similar to estimates from 1999, 2004 and 2012. Overall, the proportion of pups born in the southern Gulf of St Lawrence has declined from a high of 28% in 1994 to 2% in 2017 (Table 2).
Since the 1950s, reproductive rates have shown a declining trend while inter-annual variability has increased (Fig. 4). These highly variable reproductive rates have continued although the very low rates observed in 2010 and 2011 have not occurred again. Relatively high reproductive rates were observed in 2014 and 2015 associated with a period of extensive ice coverage and high capelin abundance (the main prey of Harp Seals) and have remained relatively high for the past five years. The longer-term decline in reproductive rates is a reflection of density-dependent processes associated with increased population size. The large inter-annual variability is due to varying rates of late term abortions which appear to be related to changes in capelin abundance, and mid-winter ice coverage (which reflects environmental conditions that influence a variety of species).
…
The Northwest Atlantic Harp Seal population has increased significantly over the past five decades. The general decline in reproductive rates over this period, as well as a decline in size at age suggests that the population is approaching its environmental carrying capacity (K). These density dependent changes are affecting the dynamics of this population although it is very difficult to determine the exact relationship between the current population and the carrying-capacity.
Sources of Uncertainty
Although reduced ice cover and quality are known to result in increased YOY mortality, the nature of that relationship is not known. It is also not known how ice cover and quality will change in the future. Nevertheless, as further reductions in ice coverage are predicted, poor ice conditions are likely to have an increased impact on YOY mortality. Reduced ice cover may also affect food availability and body condition of Harp Seals which, in turn, could impact reproductive rates. Again, the nature of these relationships is poorly understood and thus difficult to account for in the population assessment
See the full DFO report here.
References
Crockford, S.J. 2020. State of the Polar Bear Report 2019. Global Warming Policy Foundation Report 39, London. PDF here.
DFO. 2020. 2019 Status of Northwest Atlantic Harp Seals, Pagophilus groenlandicus. DFO Can. Sci. Advis. Sec. Sci. Advis. Rep. 2020/020. http://www.isdm-gdsi.gc.ca/csas-sccs/applications/Publications/result-eng.asp?params=0&series=7&year=2020 PDF here.
DFO. 2014. Status of Northwest Atlantic harp seals, Pagophilus groenlandicus. DFO Can. Sci. Advis. Sec. Sci. Advis. Rep. 2014/011. PDF here.
Peacock, E., Taylor, M.K., Laake, J., and Stirling, I. 2013. Population ecology of polar bears in Davis Strait, Canada and Greenland. Journal of Wildlife Management 77:463–476. http://onlinelibrary.wiley.com/doi/10.1002/jwmg.489/abstract?deniedAccessCustomisedMessage=&userIsAuthenticated=false
Rode, K.D., Peacock, E., Taylor, M., Stirling, I., Born, E.W., Laidre, K.L., and Wiig, Ø. 2012. A tale of two polar bear populations: ice habitat, harvest, and body condition. Population Ecology 54:3-18. http://link.springer.com/article/10.1007/s10144-011-0299-9


You must be logged in to post a comment.