
Average polar bear habitat for November 2014 was well within two standard deviations1 and higher than 2003, according to the November report from the National Snow and Ice Data Center (line and labels added, below).
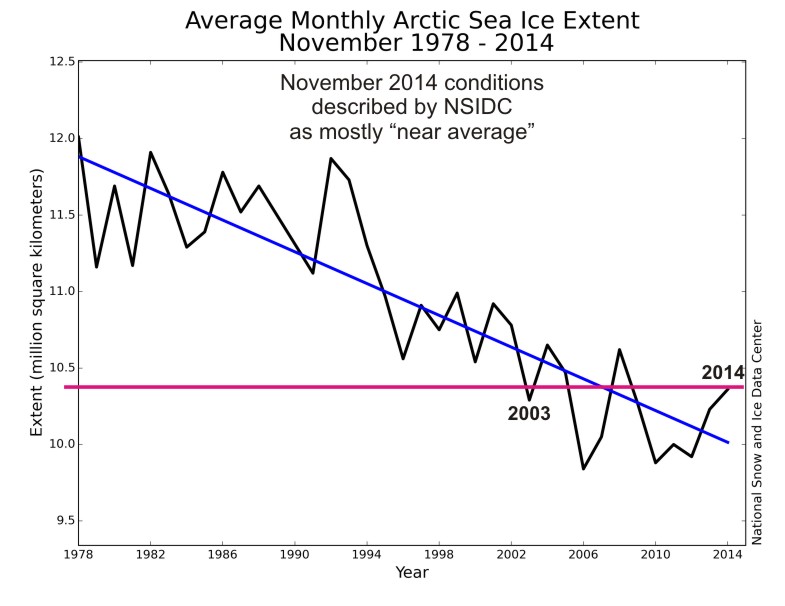
Notice that the lowest average November level occurred in 2006 — not 2007 (after the second lowest September extent since 1978) and not 2012 (after the lowest September extent since 1978). Take note that the scale on the graph above does not go to zero but to a whopping ~9.5 million square km!
Quotes from the NSIDC monthy report and sea ice maps for November 2014 and 2 December 2014 below.
UPDATE 3 December 2014: CIS has issued a new ice map corrected for ice level on Hudson Bay – new map below.
Continue reading


You must be logged in to post a comment.