“Although there have been jumps and dips, average atmospheric temperatures have risen little since 1998, in seeming defiance of projections of climate models and the ever-increasing emissions of greenhouse gases.” Jeff Tollefson, January 15, 2014, Nature. [open access]
The eminent science journal Nature has finally acknowledged that global average temperatures have not behaved as predicted by climate models over the last 16 years. [h/t A. Watts]
Note that predictions of future sea ice declines and associated predictions of future polar bear declines are totally dependent on these climate models.
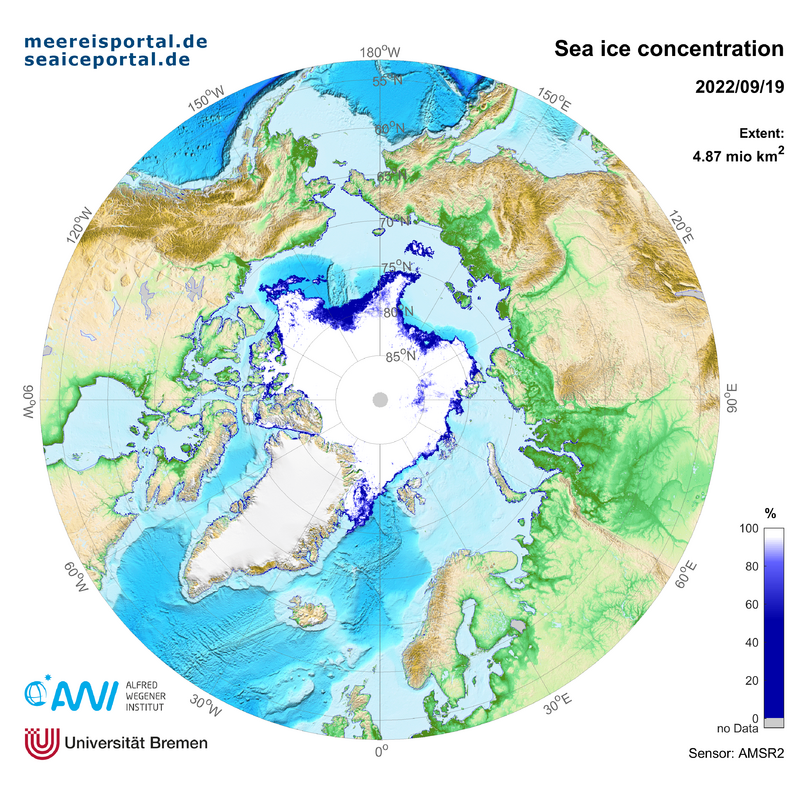
Here’s my question: if global temperatures have basically flat-lined since 1998, why has Arctic sea ice continued to decline?
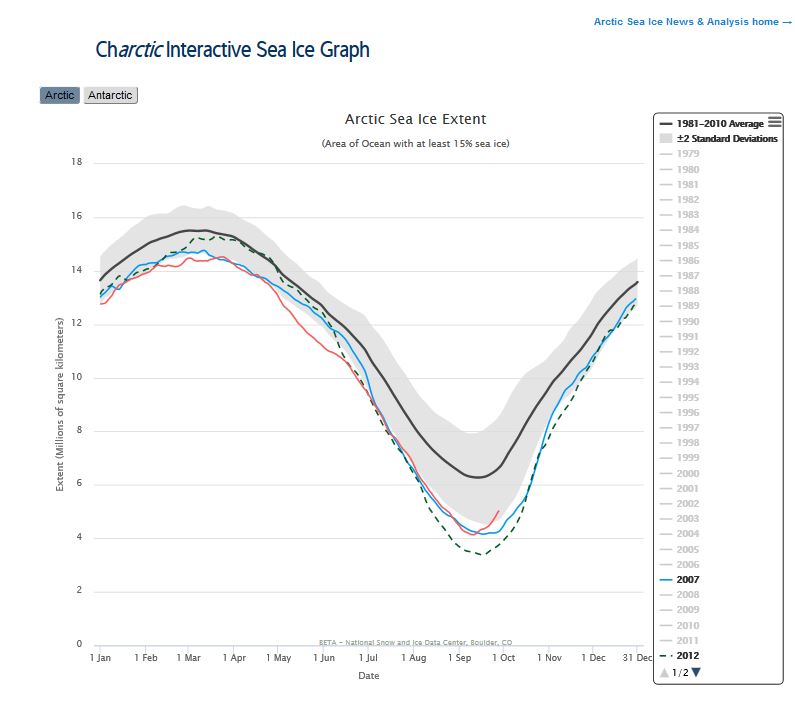
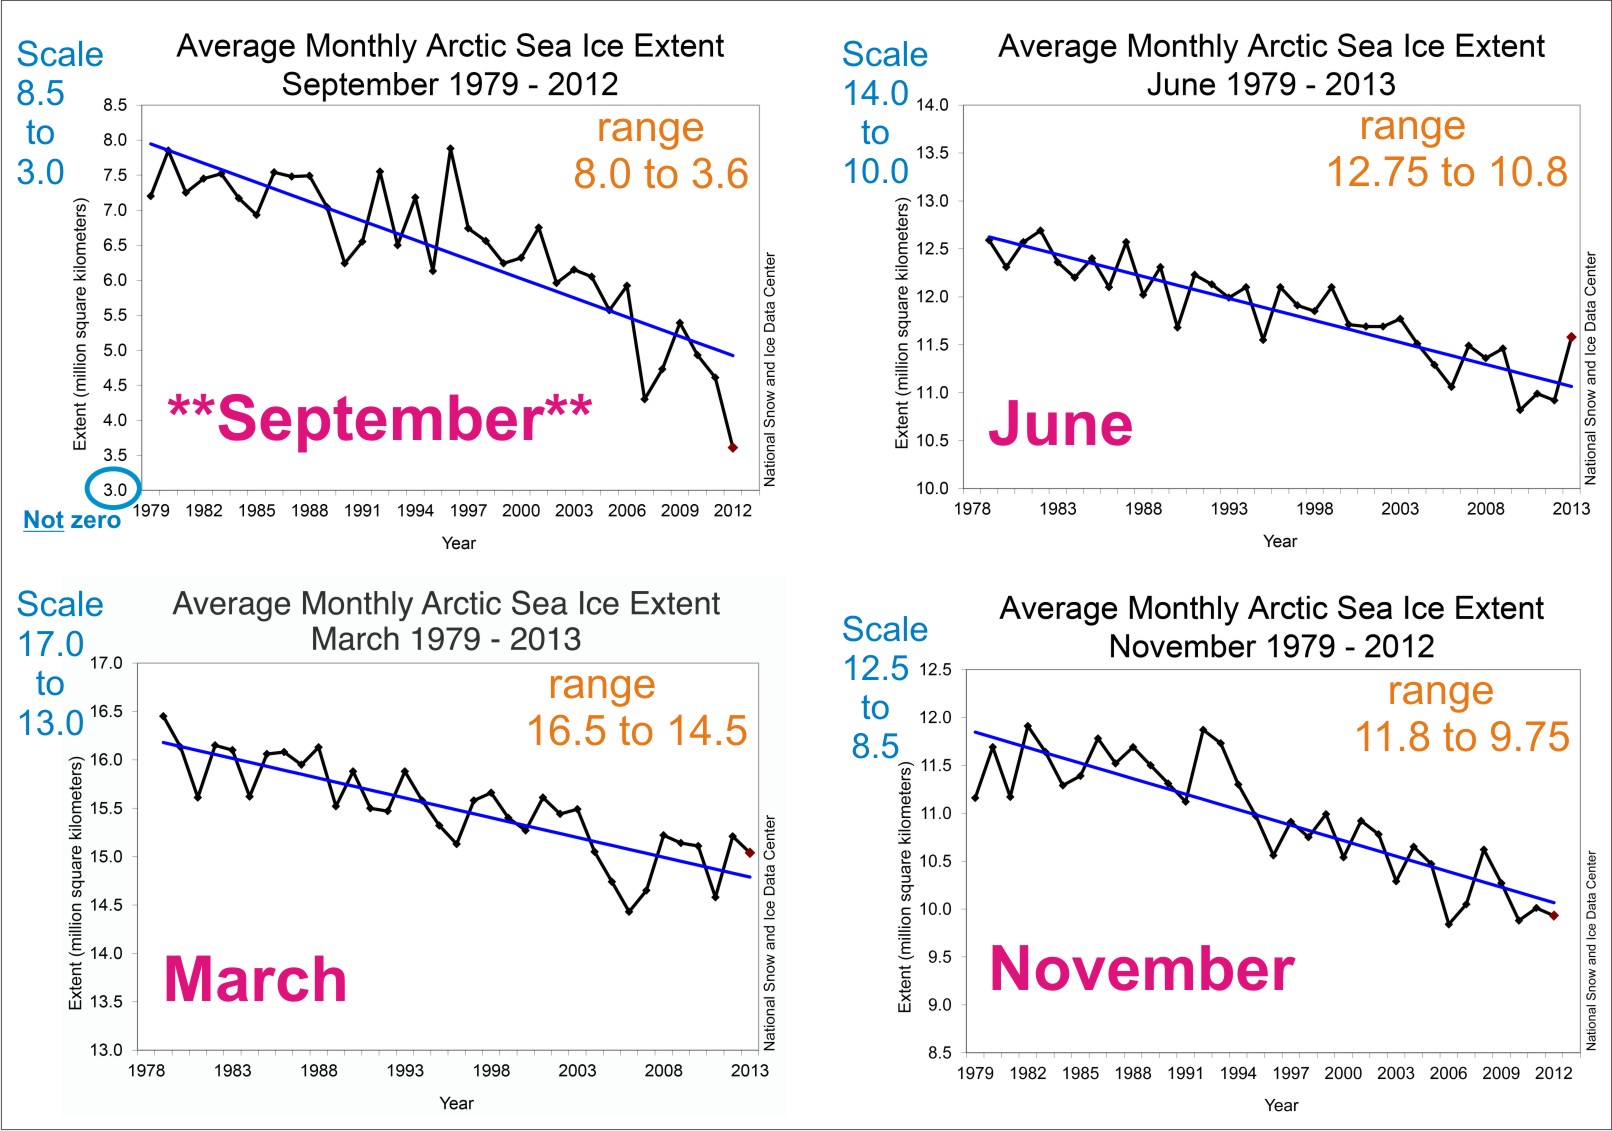
If average global temperatures govern Arctic sea ice behavior, why was 1998 (or the year after) not the lowest September sea ice extent reached over the last 30 years? Oddly, 2012 was the lowest September extent (see graphs below, from NSIDC).
Paradoxically, not only has sea ice continued to decline since 1998 – despite the hiatus in global warming – but since 1998, all but one polar bear populations have either increased in size, not declined, or are doing very well by other measures (see previous summary post, “Polar bears have not been harmed by sea ice declines“).

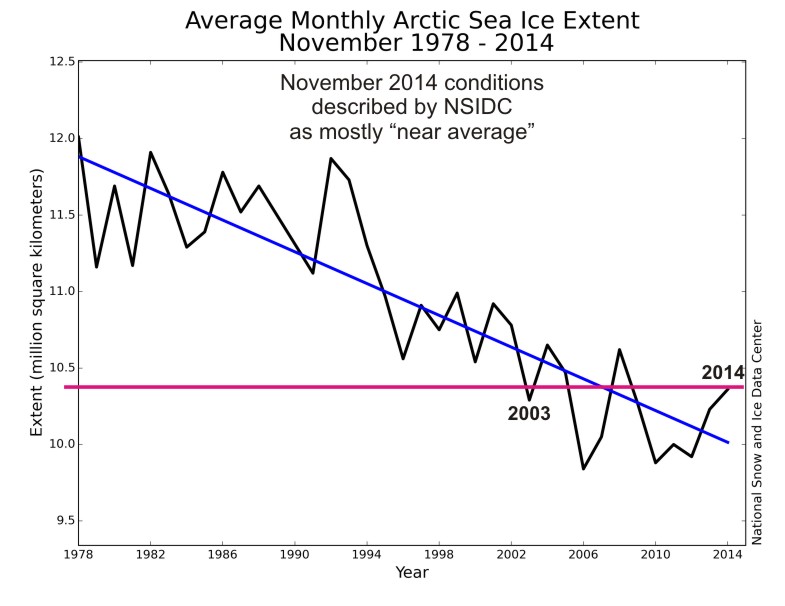
Sea ice extent graphs for September (which all the hysteria is about) compared to selected months from March, June and November. Ranges given are approximate; note the differences in scale for each graph. NSIDC graphs, colored labels added.
Continue reading


You must be logged in to post a comment.