
Average polar bear habitat for November 2014 was well within two standard deviations1 and higher than 2003, according to the November report from the National Snow and Ice Data Center (line and labels added, below).
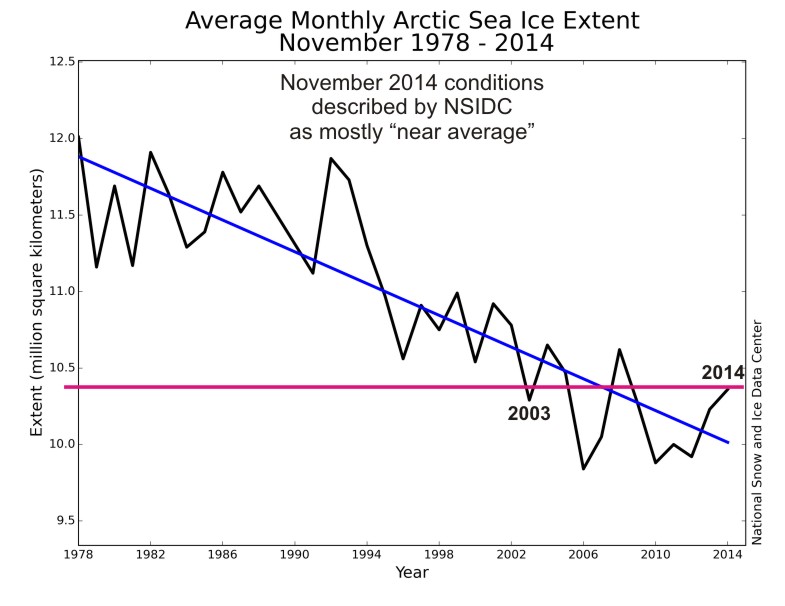
Notice that the lowest average November level occurred in 2006 — not 2007 (after the second lowest September extent since 1978) and not 2012 (after the lowest September extent since 1978). Take note that the scale on the graph above does not go to zero but to a whopping ~9.5 million square km!
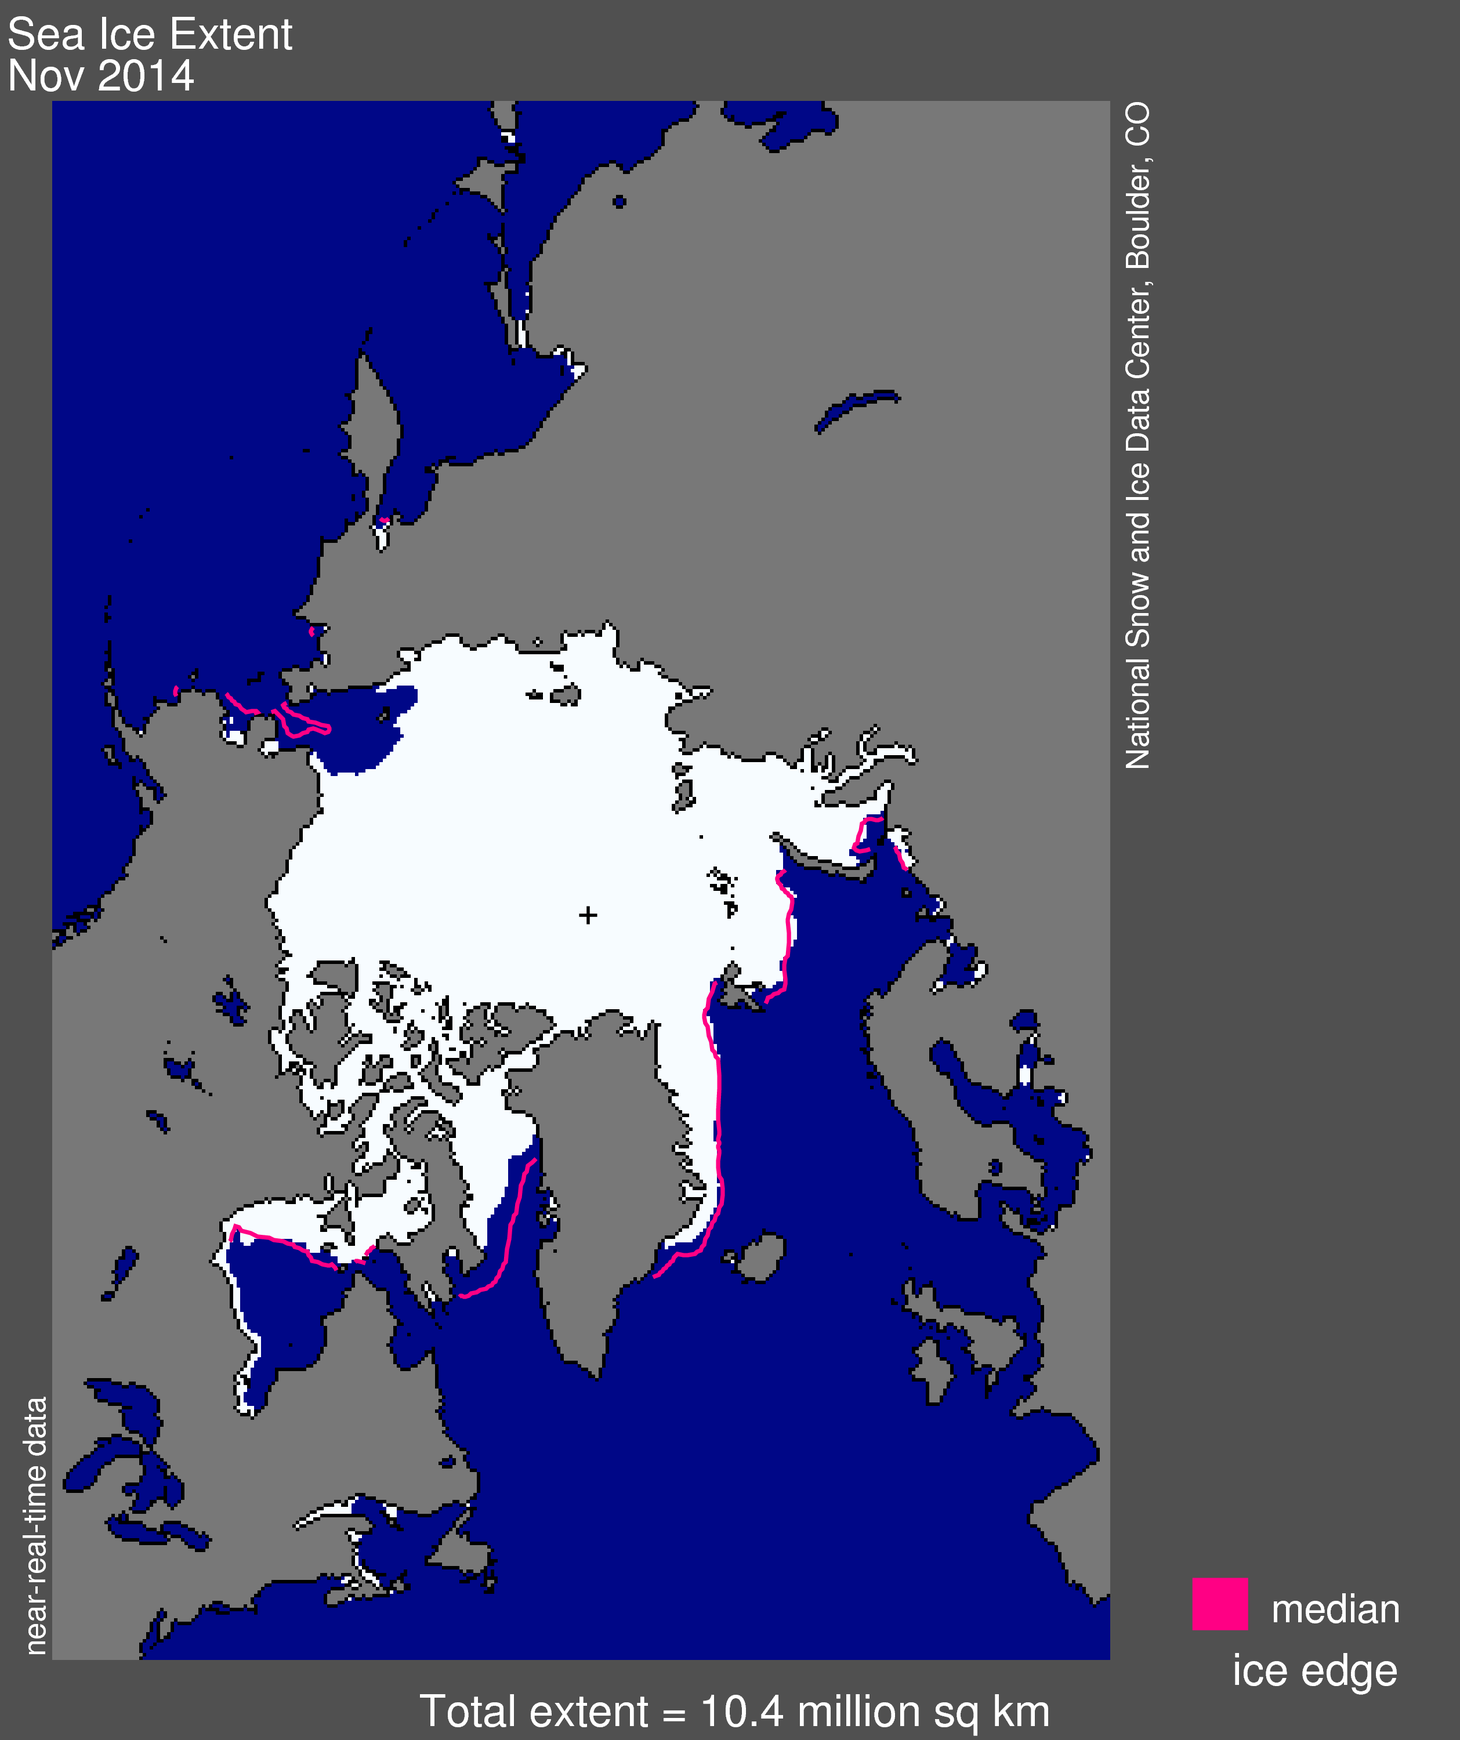
Quotes from the NSIDC monthy report and sea ice maps for November 2014 and 2 December 2014 below.
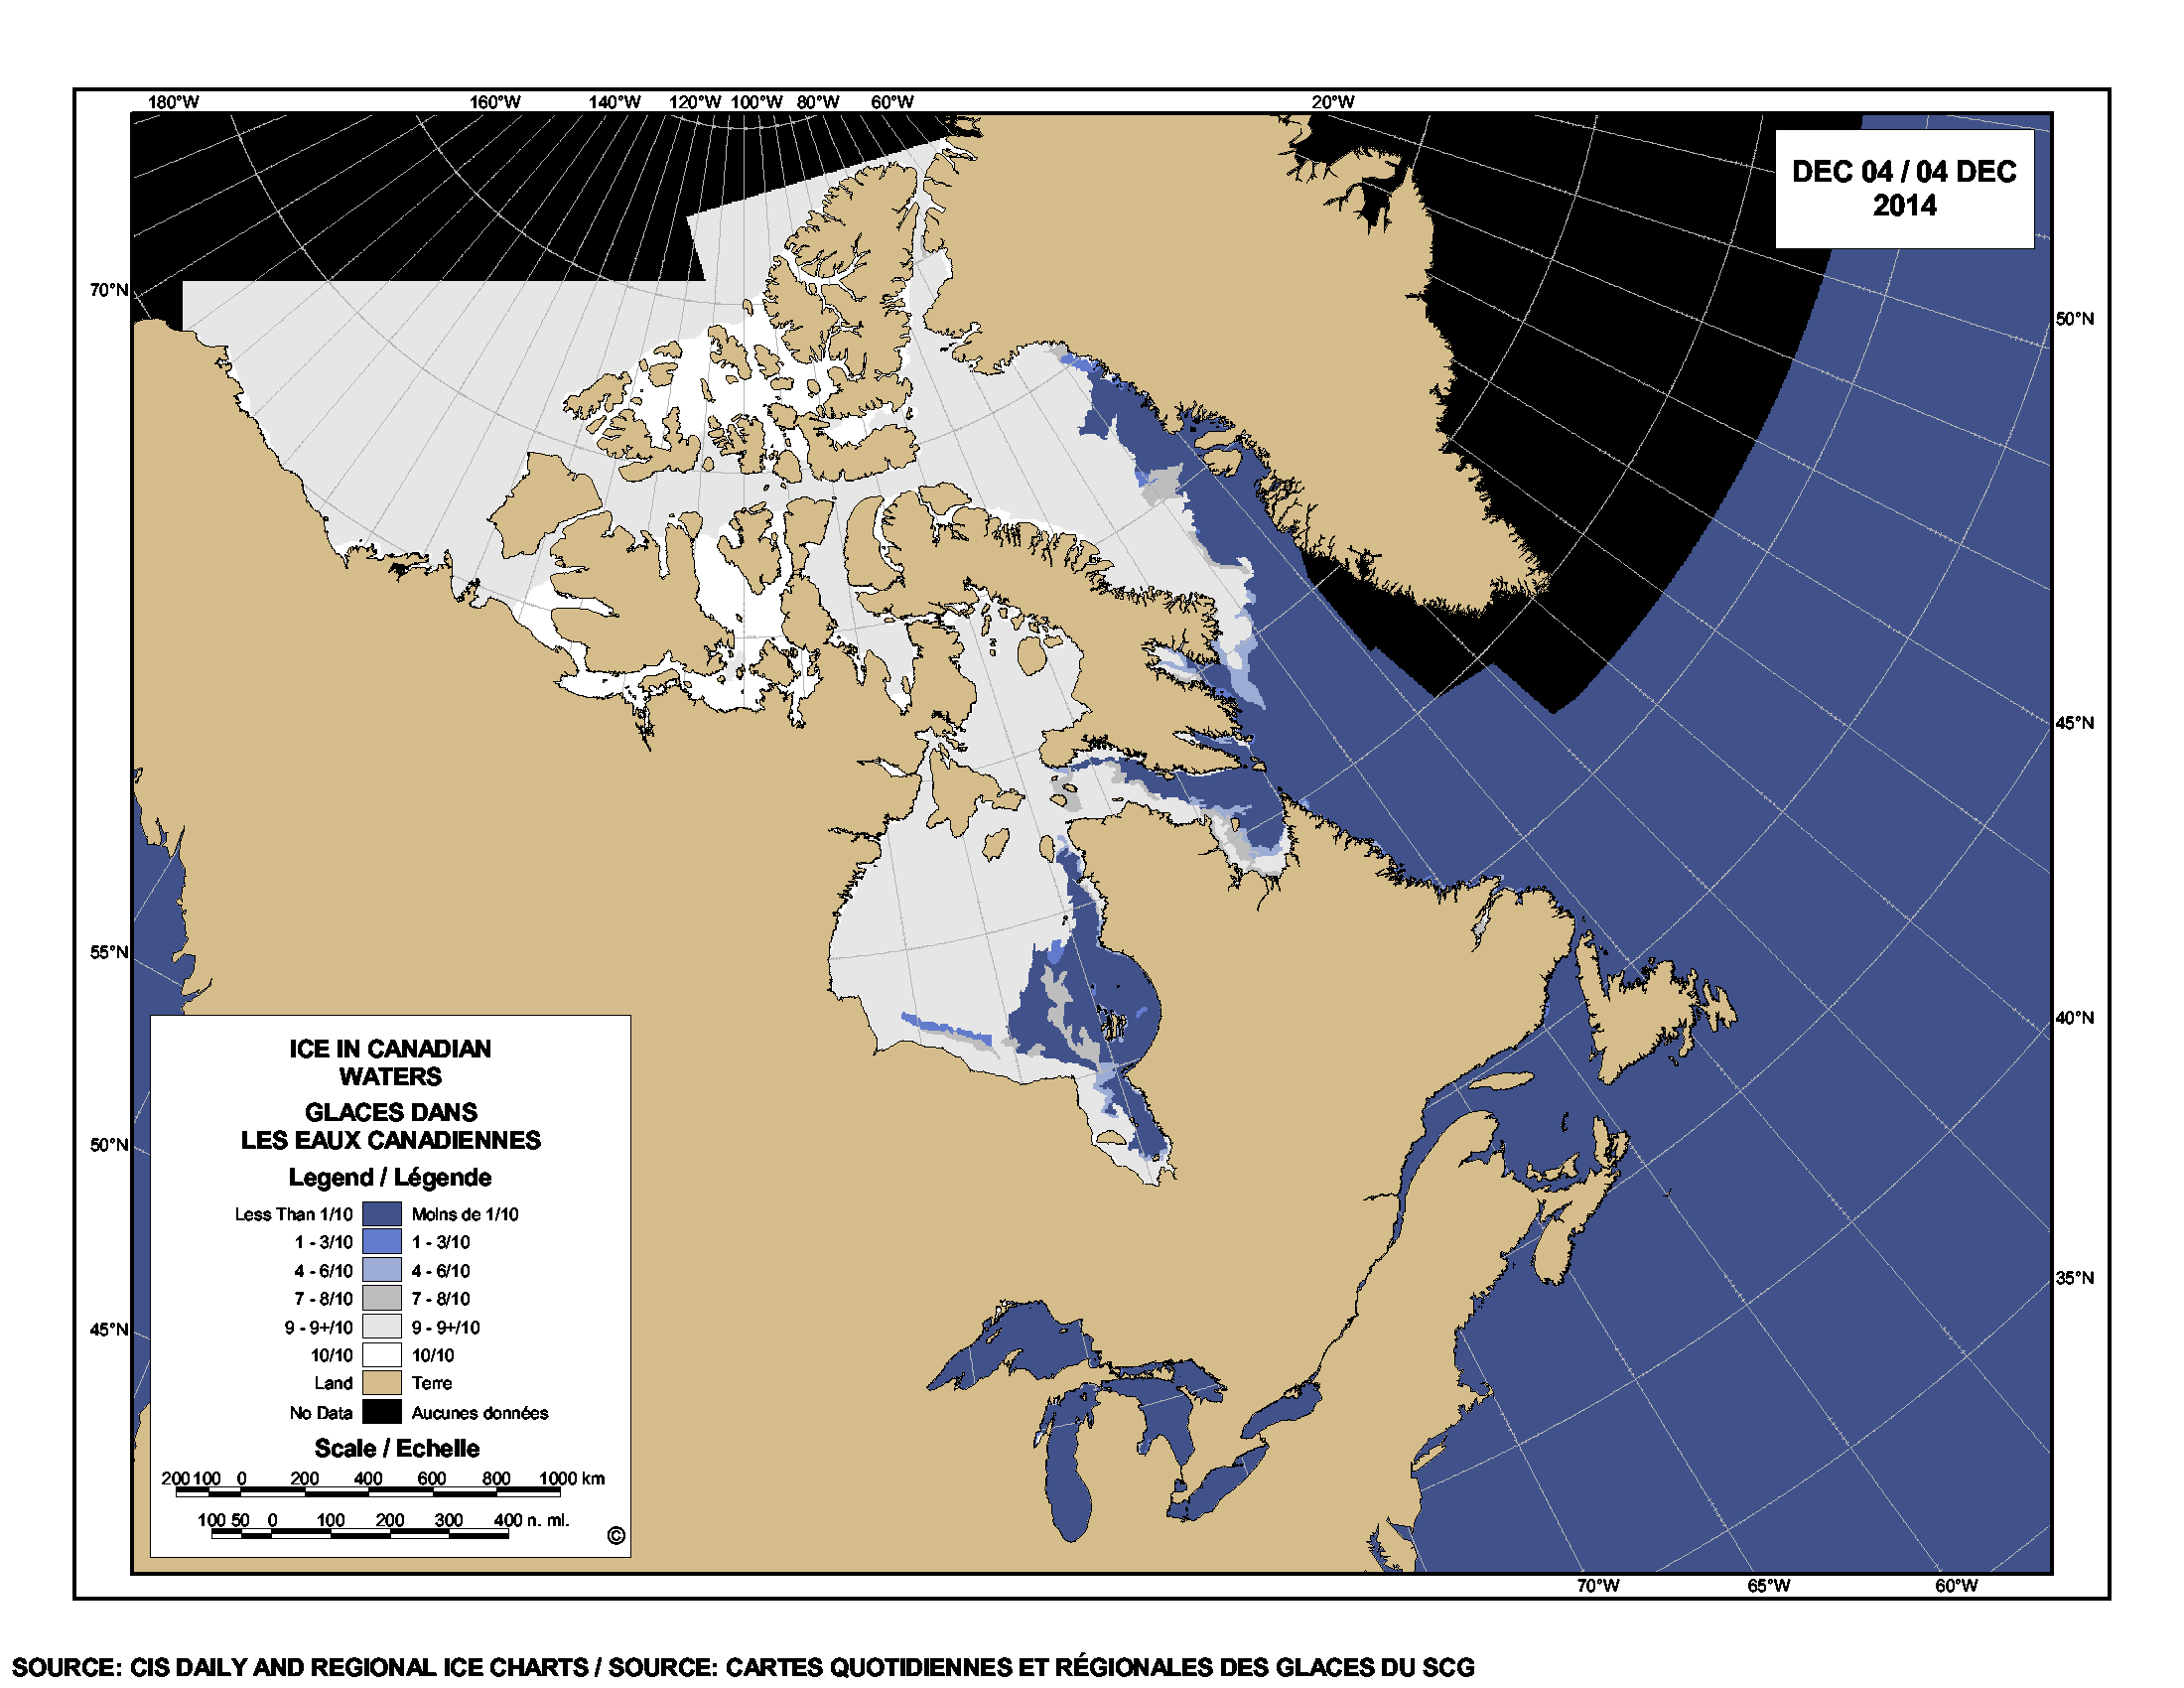
UPDATE 3 December 2014: CIS has issued a new ice map corrected for ice level on Hudson Bay – new map below.
“Arctic sea ice in November followed a fairly average growth pace. Ice extent was near average over much of the Arctic with only the Chukchi Sea and Davis Strait showing below average ice conditions.”
…
“Sea ice extent in November averaged 10.36 million square kilometers (4.00 million square miles). This is 630,000 square kilometers (243,000 square miles) below the 1981 to 2010 long-term average of 10.99 million square kilometers (4.24 million square miles) and 520,000 square kilometers (201,000 square miles) above the record low for the month observed in 2006.
Arctic sea ice extent continued to increase throughout the month of November. By the end of the month, most of the Arctic Ocean was covered by ice, the exception being the Chukchi Sea that remained unusually ice free for this time of year. Ice also began to extend into Hudson Bay and Baffin Bay, although ice growth was slower than average in Davis Strait. The near-average ice conditions in the East Greenland, Barents and Kara seas have not been seen in the last few winters, and is the reason that overall extent for November is higher than in recent years.”
[NSIDC Arctic Sea Ice News and Analysis for November 2014]
Note the NSIDC map for yesterday (2 December 2014, below) shows continued growth, especially in Hudson Bay, although Davis Strait and the Chukchi Sea are still below average. The extent shown in this map is still at odds with levels shown in Canadian Ice Service maps (also below) — I don’t know why [UPDATE: Map for 4 December corrects this, see below – lots of ice on Hudson Bay – more than average according to NSIDC].
We are now exactly 11 weeks past the September minimum (17 September 2014, 5.02 mkm2). Polar bear habitat has more than doubled since then.
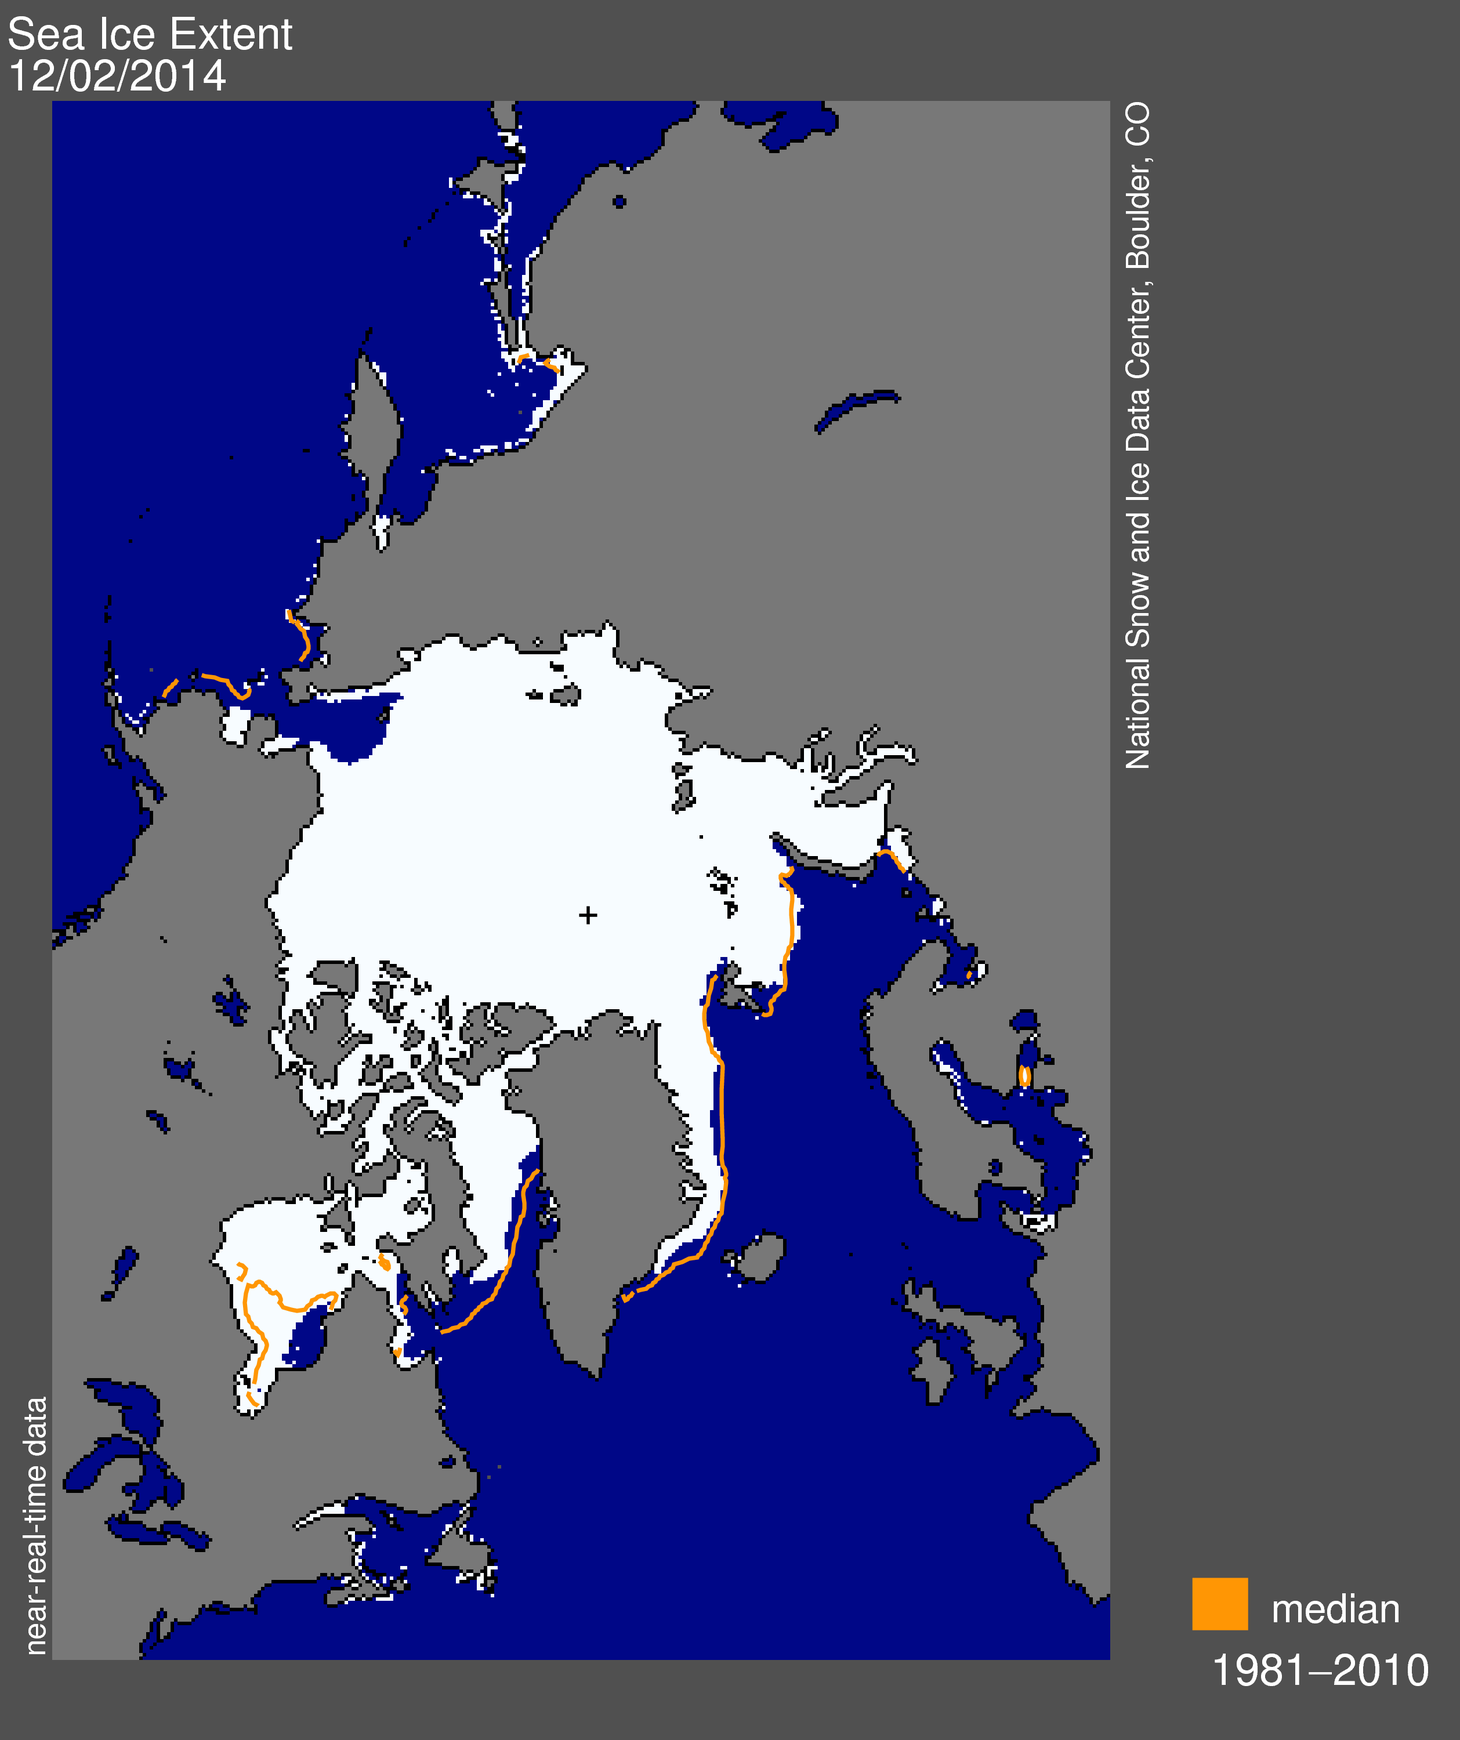
2 December map below, 4 December update map below that:
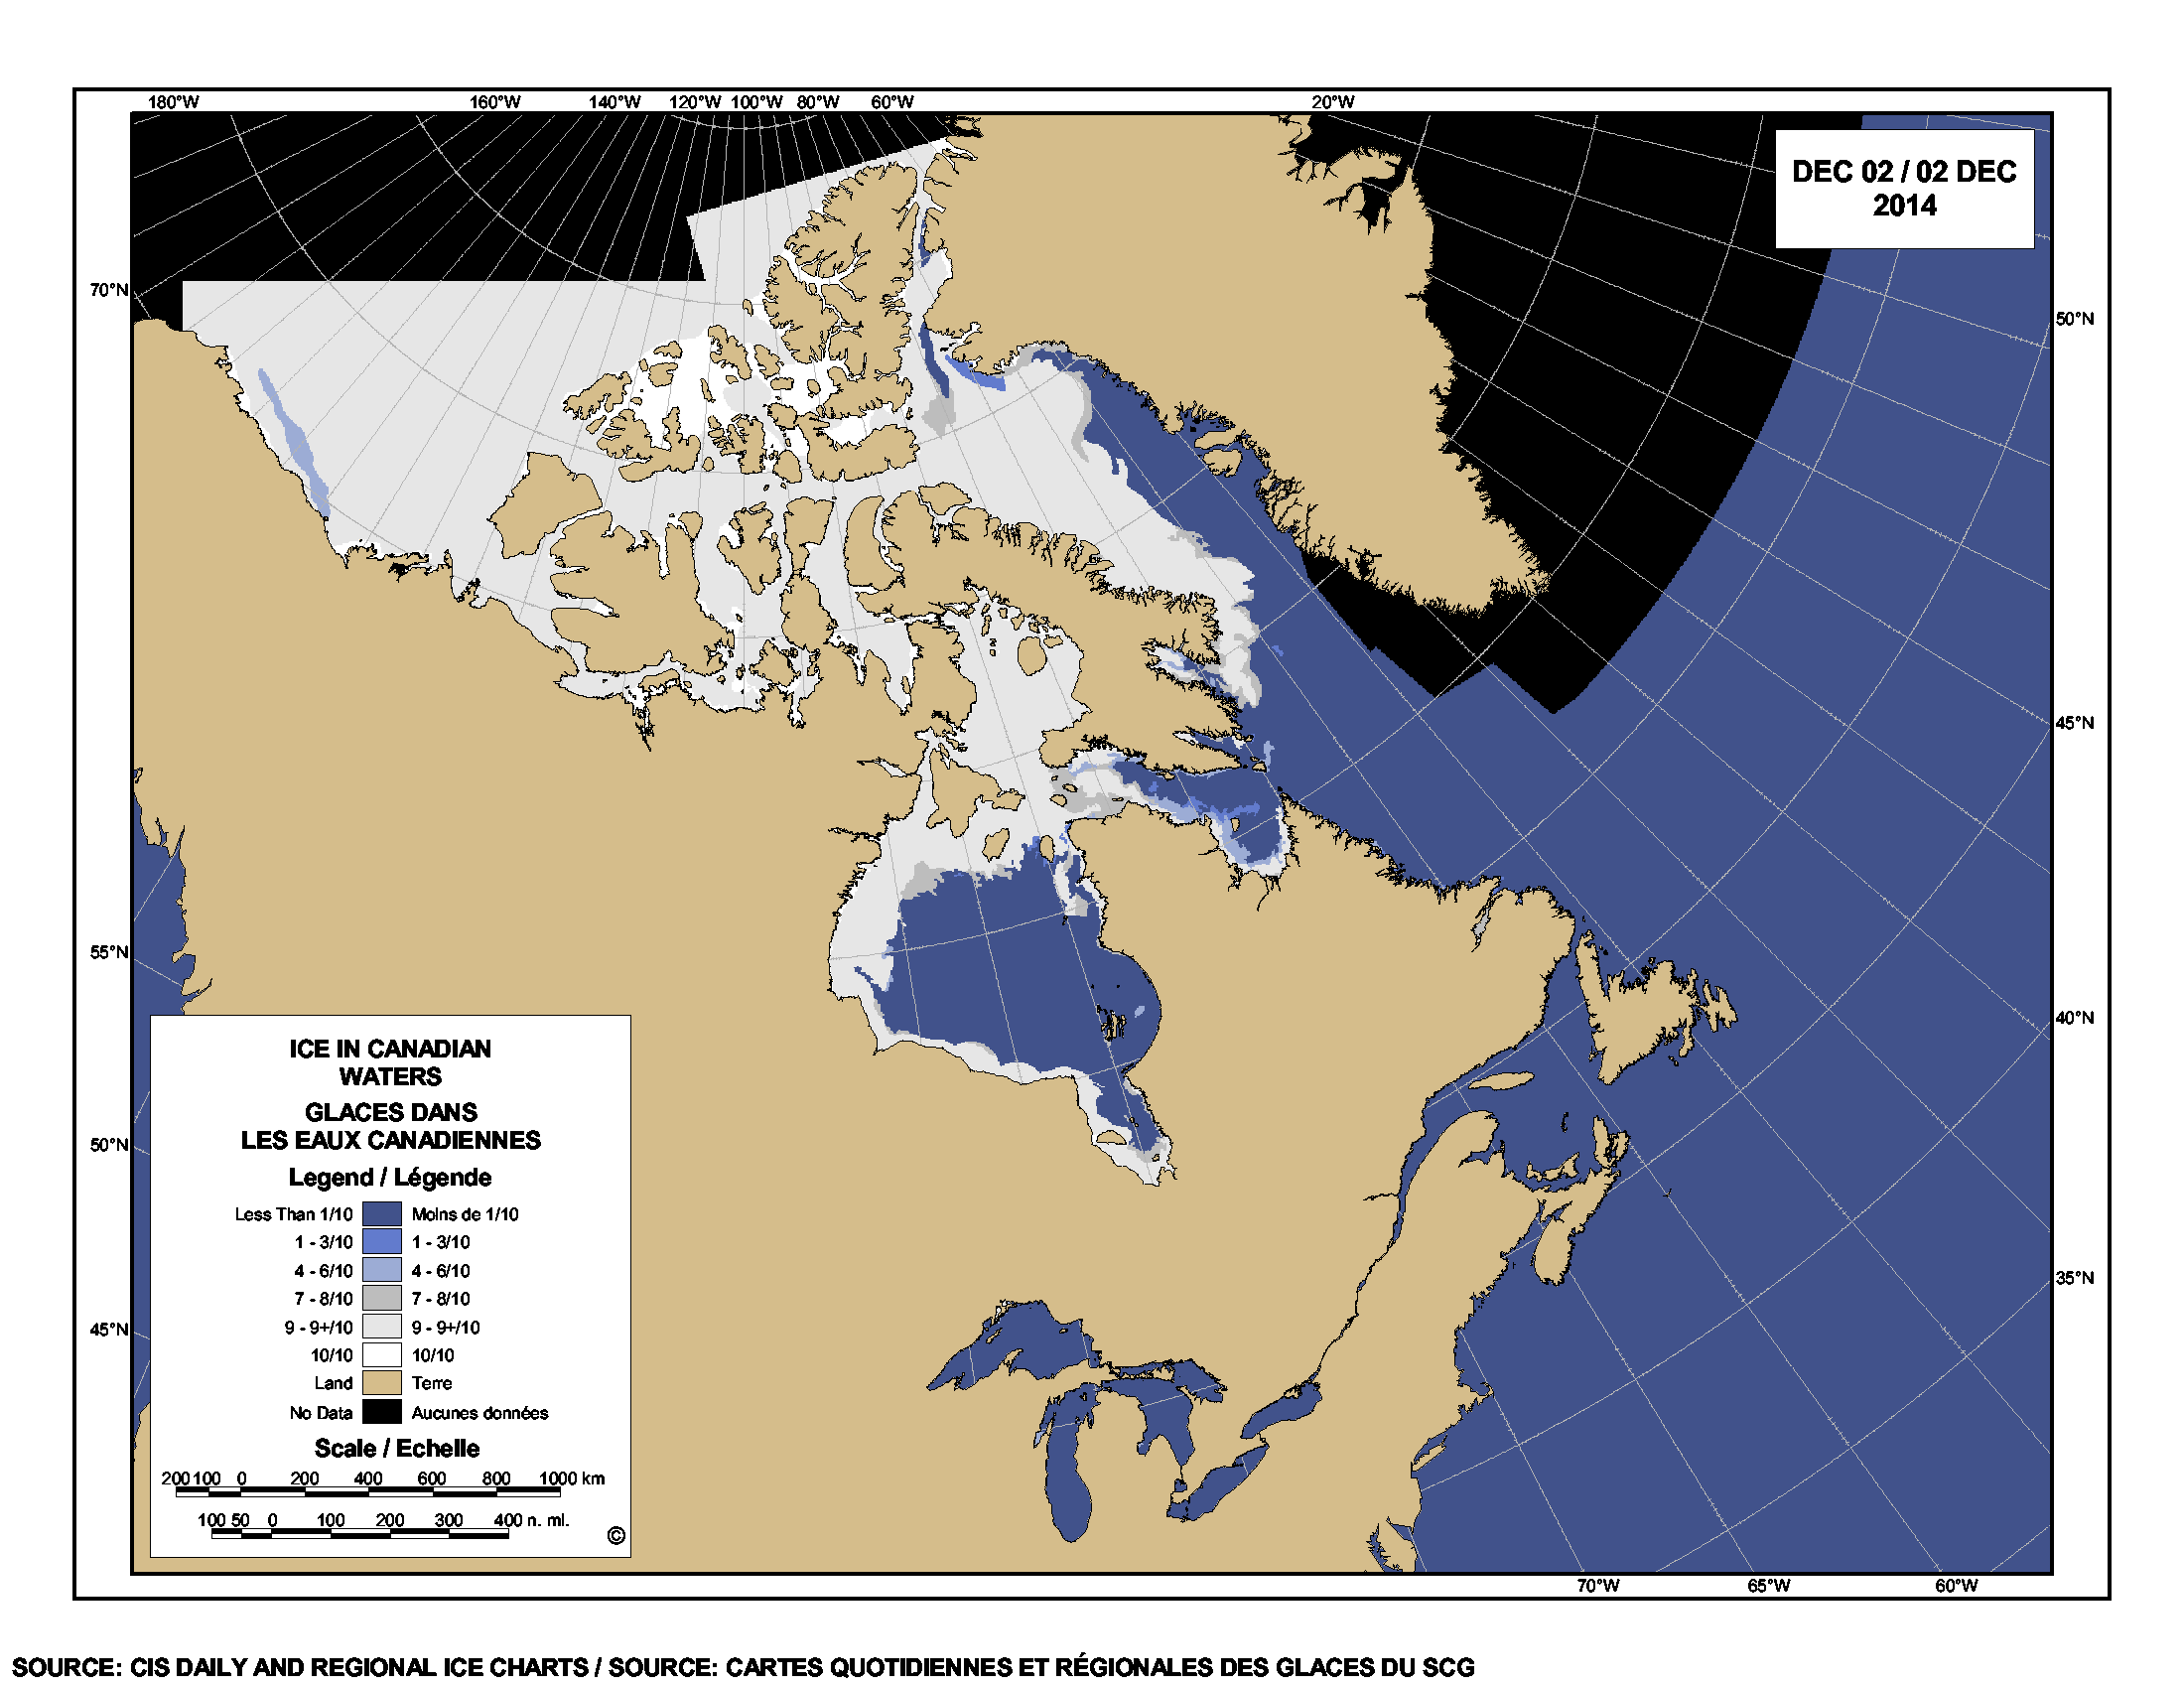
Corrected ice map for Hudson Bay appeared 4 December (below) – what a difference!
See my discussion of last year’s November ice coverage here.
Footnote 1: (Two standard deviations: “Measurements that fall far outside of the two standard deviation range or consistently fall outside that range suggest that something unusual is occurring that can’t be explained by normal processes”).


You must be logged in to post a comment.