Tag Archives: CIS

Hudson Bay breakup later than average, longer hunting season for polar bears

Due to the atypical pattern of sea ice melt on Hudson Bay this year, 2015 will definitely be a later than average breakup year – perhaps not as late as 1992 but maybe almost as late as 2009. Easing into the first days of Arctic summer, there is still a lot of polar bear habitat left on Hudson Bay, especially in the east.

Hudson Bay breakup 2015 vs 2009 at 29 June_MASIE

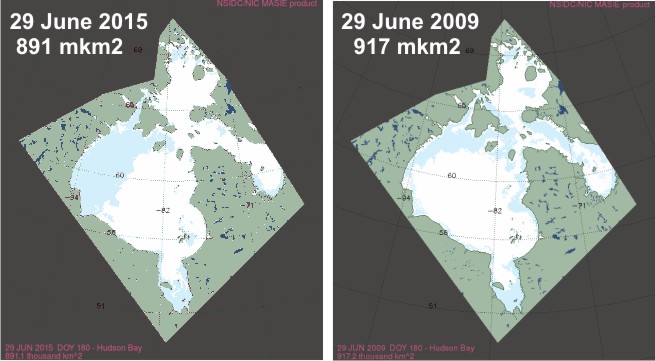
Although official breakup in 2009 was only a little later than usual (9 July), bears came ashore about the same time (after mid-August) as they did in 1992, when breakup was very late (30 July). With the pattern this year being so unusual (and the melt so slow over the last few weeks), who knows how late it could be before the last bears leave the ice in 2015?

There is definitely more sea ice this year on the bay than there was last year, when breakup was about average for the last 24 years.

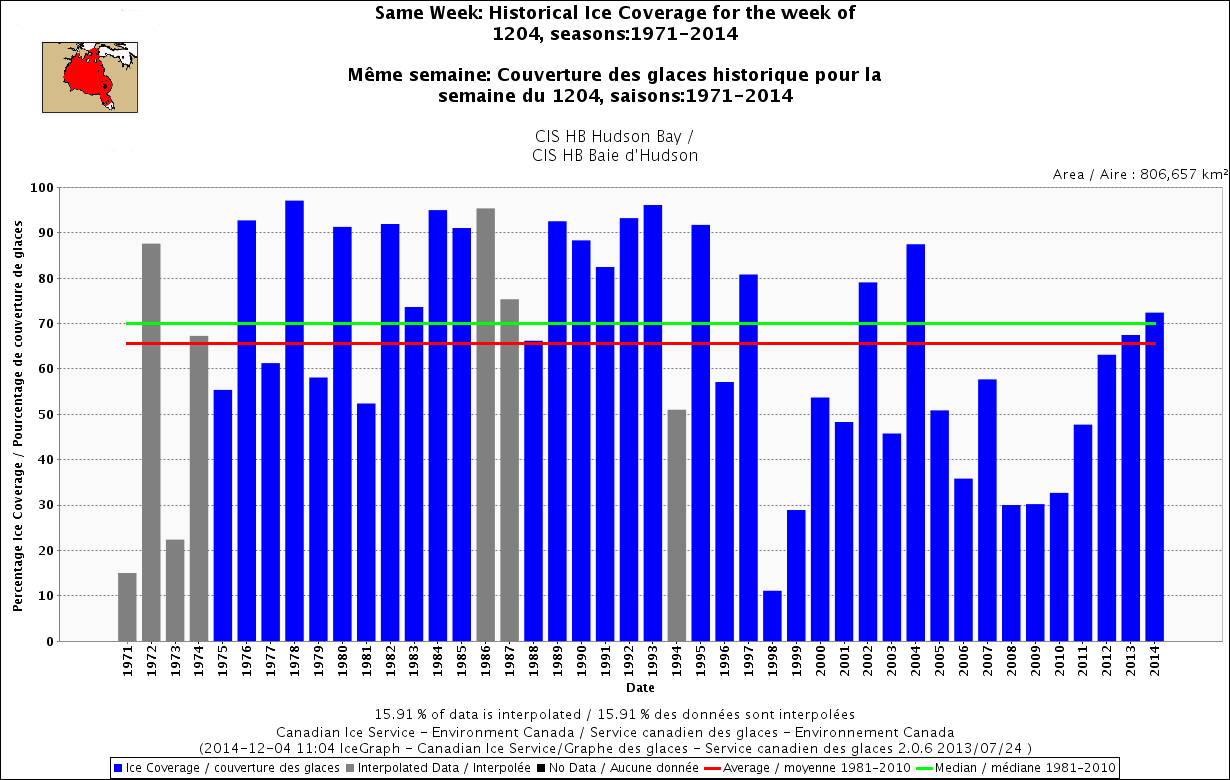
UPDATE 2 July 2015: CIS weekly ice coverage graphs added to the end of this post. Hudson Bay ice highest since 2009 and Davis Strait highest since 1994! Have a look.
Continue reading

Hudson Bay sea ice above average for this date – more good news for polar bears

It’s only the 4th of December and Hudson Bay ice formation is way up over late 2000s coverage for this date — and higher than 2012, which had the lowest overall September ice extent for the Arctic since 1978.

Hudson Bay freeze-up same week_Dec 4 1971_2014 w average

This means boom times for Western and Southern Hudson Bay polar bears as sea ice formation is several days to a week ahead of last year. And as I mentioned in my last post, average November ice coverage across the Arctic this year was higher than 2003. Don’t forget that 2/3’s of the world’s polar bears live in Canada (see recent status update here; map below).

Figure 4. The Davis Strait (DS) subpopulation region runs from just below the Arctic Circle at the north end to at least 470N in the south. About half of DS lays at the same latitude as Western Hudson Bay (WH). Courtesy Environment Canada.

Polar bear population status in Canada. Courtesy Environment Canada.

More maps and charts below.
Continue reading

Polar bear habitat update – November 2014 average sea ice levels higher than 2003

Average polar bear habitat for November 2014 was well within two standard deviations1 and higher than 2003, according to the November report from the National Snow and Ice Data Center (line and labels added, below).

Arctic ice Nov aver_NSIDC_sm_PolarBearScience

Notice that the lowest average November level occurred in 2006not 2007 (after the second lowest September extent since 1978) and not 2012 (after the lowest September extent since 1978). Take note that the scale on the graph above does not go to zero but to a whopping ~9.5 million square km!

Quotes from the NSIDC monthy report and sea ice maps for November 2014 and 2 December 2014 below.

UPDATE 3 December 2014: CIS has issued a new ice map corrected for ice level on Hudson Bay – new map below.
Continue reading

Summer sea ice melt and polar bear maternity dens

The yearly sea ice minimum extent is almost upon us, which has recently been the seasonal signal for excitable biologists and their activist groupies to resume their breathless rants about what sea ice loss could mean for polar bears.

Polar bear den_CreditUSFWS_labeled

Never mind that the summer minimum extent reached in September, no matter how low it goes, is pretty much irrelevant to polar bear health and survival. As I’ve discussed before, what’s really important is the presence of not-too-thick ice during the spring, so they can catch lots of young seals and put on lots of fat.

But to a lesser degree, the extent at mid-to-late summer is important because this is when pregnant females that prefer to make their maternity dens on shore are looking for good places to spend the winter.

So the topic for today is this: how much does the extent of ice at the height of summer dictate where polar bear females make their winter dens?
Continue reading

Davis Strait polar bear habitat higher now than in 1979 and early 1980s

The Davis Strait polar bear subpopulation is said to be ‘vulnerable’ to the supposed effects of global warming because, like Hudson Bay, Davis Strait sea ice retreats every summer, leaving polar bears on land for several months.

However, Davis Strait bears have been upgraded to ‘stable’ status, according to the latest table (2013) issued by the IUCN Polar Bear Specialist Group (see their boundary map for Davis Strait bears below). Recent development of sea ice in the region can only improve that rating.

[More background here and heremap-DavisStrait

It seems that sea ice in Davis Strait is well above normal for this time of year – a recent announcement by the Canadian Ice Service (CIS) says it’s 10% above average, higher than it’s been in 25 years (h/t S. Goddard).

The Canadian Ice Service, an arm of Environment Canada, said there is 10 per cent more ice this year compared to the 30-year average.

We probably haven’t seen a winter this bad as far as ice for the past 25 years,” said Voight, referring to both the amount and thickness of the ice.

He said the Gulf of St. Lawrence is covered and some areas are “quite severe.” [my bold]

Full story here.

Latest ice map (March 12) below from the US National Snow and Ice Data Service (NSIDC).

As I pointed out recently here, Barents Sea ice is below average this year, largely due to natural variation in the Atlantic Multidecal Oscillation (AMO), but is higher over the western Atlantic (Sea of Okhotsk ice is below average too but there are no polar bears there).

There is lots of ice around Labrador and Newfoundland, however.

Sea ice extent 2014 March 12 NSIDC

I thought I let you see exactly what CIS are talking about: what did the ice look like 25 years ago, in 1989? What about 35 years ago, in 1979, the start of the satellite record for sea ice? It might surprise you. Continue reading