Tag Archives: trends

Baffin Bay and Kane Basin polar bears not ‘declining’ concludes new report

The 2016 Scientific Working Group report on Baffin Bay and Kane Basin polar bears was released online without fanfare last week, confirming what local Inuit have been saying for years: contrary to the assertions of Polar Bear Specialist Group scientists, Baffin Bay and Kane Basin subpopulations have not been declining but are stable.

polar-bear-feeding_shutterstock_sm

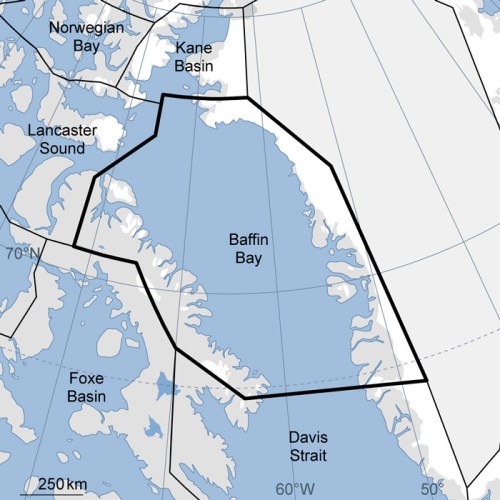
Until recently, the Baffin Bay (BB) and Kane Basin (KB) polar bear subpopulations, that live between NW Greenland, and Baffin and Ellesmere Islands, were assessed with confidence by the IUCN Polar Bear Specialist Group (PBSG) to be declining due to suspected over-hunting (see 2016 Report, Ch. 1, pg. 4).

It turns out they were wrong.

map-baffinbay

New (2016) polar bear subpopulation estimates for BB and KB:

Baffin Bay 2,826 (95% CI = 2,059-3,593) at 2013

                  [vs. 1546 (95% CI = 690-2,402) expected 2004]

                  vs. 2,074 (95% CI = 1,553-2,595) in 1997

  Kane Basin357 (95% CI: 221 – 493) at 2013

                    vs. 164 (95% CI: 94 – 234) in 1997

[1997 figures from 2015 IUCN Red List estimates, from Supplement, pg. 8); 2004 “expected” figure for Baffin Bay from 2016 SWG report, Ch. 1, pg. 4]

In 2014, Environment Canada’s assessments were ‘data deficient’ for Kane Basin and ‘likely declining’ for Baffin Bay (see map below):
ec_polarbearstatus_and-trends-lg_2010-2014-mapscanada_oct-26-2014

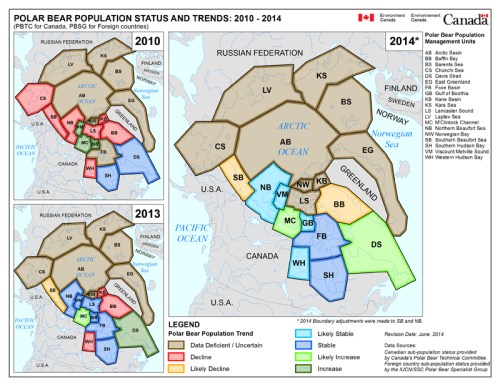
However, the results of this new study (conducted 2011-2013) would likely make KB in the map above dark blue (‘stable’), and BB light blue (‘likely stable’), depending on how the new information is interpreted (given differences in methodology between the 1991-1997 and 2011-2013 counts). Note that a recent paper by Jordan York, Mitch Taylor and others (York et al. 2016) suggested this outcome for Baffin Bay was likely (i.e. ‘stable’) but thought that the status of Kane Basin would remain ‘declining.’

This new information leaves only the Southern Beaufort subpopulation (SB) in a ‘likely declining’ condition, but since that decline was due to thick spring ice conditions in 2004-2006 (Crockford 2017), it does not reflect a response to recent loss of summer sea ice. The new population estimates for Baffin Bay and Kane Basin also suggests that a revision needs to be made to the 2015 IUCN Red List assessment with respect to the global population estimate because polar bears are clearly more abundant in Baffin Bay and Kane Basin than previously thought.

Continue reading

New paper updates lack of trend in W Hudson Bay breakup/freeze-up dates to 2015

A newly-published paper shows that there has been no trend in the time Western Hudson Bay polar bears spent onshore between 2001-2015 due to sea ice conditions at breakup or freeze-up (previously available to 2010 only), despite the marked decline of global sea ice since 2007.

castro-de-la-guardia-et-al-derocher-2017-fig-3-no-caption

Figure 3 from Castro de la Guardia and colleagues (2017) showing freeze-up and breakup dates and ice-free days 1979-2015 for Western Hudson Bay. Figure with caption, copied below, explains symbols.

Previously, a 2007 paper by Eric Regehr and colleagues for WHB bears up to 2004, which was used to support the US bid to list polar bears as ‘threatened’ with extinction, concluded that between 1984 and 2003, bears were spending 3 weeks longer onshore than they did in the 1980s.

The big news from Castro de la Guardia et al. (2017) is that polar bears spent longer onshore from 1979-2015 by … 3 weeks. That is, no change from the situation in 2004. Wow!

Note the population size of the entire WHB subpopulation has also not declined since 2004 and is currently estimated at about 1030, based on a 2011 aerial survey (Stapleton et al. 2014).

Thanks to Andrew Derocher for the heads-up tweet.

From the abstract (my bold):

We found that the ice-free period in this region lengthened by 3 ± 0.8 wk over the period 1979−2015. Polar bears migrated onshore 2 wk earlier and offshore 1 wk later in the period 2005−2015 than in 1980−1989.

Here is the region in question, illustrated by Fig. 1 from the paper:

castro-de-la-guardia-et-al-derocher-2017-fig-1a-location
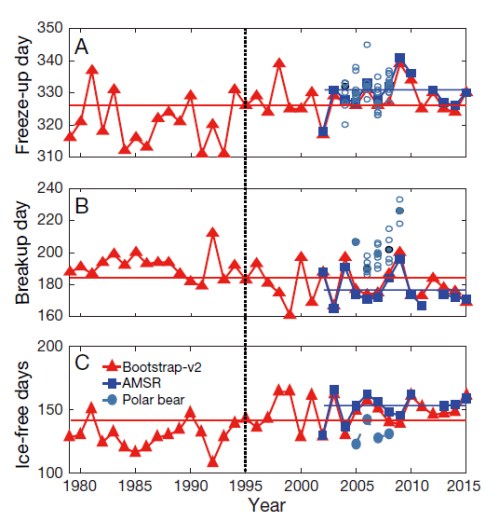
The significant information contained in this paper is breakup and freeze-up dates and length of the ice-free period data for 2010-2015, which has been unavailable until now. More excerpts and comments below, including Figure 3 with its caption.
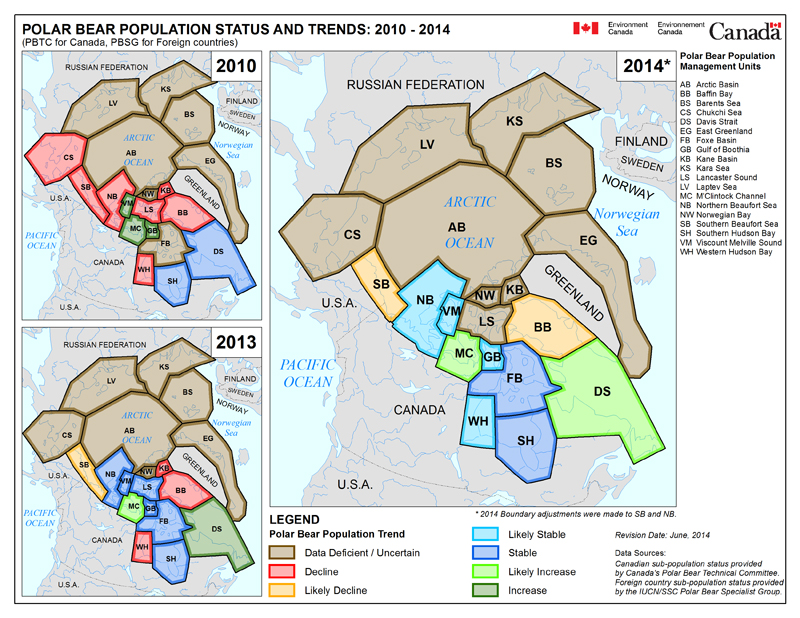
 Continue reading

Status of Canadian polar bear populations has been changed – more good news

According to maps dated June 2014, Environment Canada (EC) has changed the trend status of several Canadian subpopulations — without any announcement or publicly-available documents explaining the basis of the changes.

Figure 3. "Series of Circumpolar Polar Bear Subpopulation and Status Trend Maps 2010, 2013 & 2014" Note the asterisk below the 2014 map, which is dated "June 2014" and is different in its status assessment from the one released in February 2013 by the PBSG. Original here.

Figure 1. Environment Canada’s “Map 4: Series of Circumpolar Polar Bear Subpopulation and Status Trend Maps 2010, 2013 & 2014.” Original here.

And would it surprise you to learn that virtually all of these status changes reveal more good news about polar bears?
Continue reading

Declining polar bear weights and early breakup dates in WHB, Part I: What’s a starving bear?

The oft-repeated claim that polar bears are starving in Western Hudson Bay (e.g., here, here, here, and here) comes primarily from a 10 year old study that documented a declining trend in polar bear body condition (a biology euphemism for relative fatness) between 1980 and 2004, which appeared to correlate with earlier and earlier breakup dates for Hudson Bay.

Figure 1. Polar bear female with cub, 2009, Churchill, Western Hudson Bay. Wikipedia.

Figure 1. Polar bear female with cub, 2009, Churchill, Western Hudson Bay. Wikipedia.

The authors of that study (polar bear specialist Ian Stirling and NASA sea ice researcher Claire Parkinson) reported the body weights of lone female bears captured in Western Hudson Bay between 1980 and 2004. The trend over time in those bear weights was then correlated with the overall change in dates of sea ice breakup on Hudson Bay for that period.

However, it turns out that while the trend of body condition and the trend in breakup dates indeed correlated over time, the actual year to year data did not. The question is, what does that mean for the claim that polar bears in WHB are starving?
Continue reading

PBSG polar bear population assessment made simple

[Update: Feb. 10 2013. I have corrected an oversight in the summary tables – the originals neglected to indicate that the Barents Sea subpopulation is shared between Norway and Russia (not controlled by Norway alone). Here is revised Table 1 and revised Table 2. ]

[Update 2: Sept. 26, 2013. See Global population of polar bears has increased by 2,650-5,700 since 2001″ for further insight. I have also made slight corrections to the tables below, now marked Version 3.]

A couple of weeks ago, a news report appeared highlighting an interview with Russian biologist Nikita Ovsyannikov, deputy director of Russia’s polar bear reserve on Wrangel Island in the Chukchi Sea. This is what the news report said:

He [Ovsyannikov] guessed the number of bears around the Chukchi Sea, which also sometimes migrate in small numbers to western Alaska, had dropped over the past three decades from “about 4,000 to no more than 1,700 at best.

See Kelsey’s comments over at Polar Bear Alley and the comment I left there, here and my related previous post here

This media focus on Chukchi Sea polar bear numbers caught my attention because I had recently spent some time going through the 15 Polar Bear Specialist Group (PBSG) meeting reports in an effort to summarize the population estimates they provided. This international group first met in Fairbanks, Alaska in 1965 to advance and coordinate polar bear research and conservation under the auspices of the International Union for Conservation of Nature (IUCN) and the Species Survival Commission (SSC). I knew that according to the PBSG, the population of the Chukchi Sea is zero – that is, no Chukchi bears are included in the official total of 20,000-25,000 bears because no reliable survey had ever been done. Ovsyannikov’s statement to the press encouraged me to finish my summary of the population estimates in the PBSG meeting report tables.

This was not an easy task, in part due to the virtually constant changes in presentation style and format in the tables used to present the data (which appeared first in the 1981 report). For example, even between the 14th (2005) and 15th (2009) meeting reports, the population data table presents the subpopulations in different order and swaps the position of two critical columns (“status” and “observed or predicted trend”), making it extremely difficult for readers to do a quick comparison between years.

So I simplified the 2009 table (the most recent available), leaving out the future predictions as irrelevant to questions about current status. I included some population estimates and status assessments from previous reports to show the changes over time (where available). The full summary table, designated Table 1,  is provided here as a pdf. [update 2013 – this is Version 3]. However, in this format, it still spans two pages, so I composed another  table that contains the 2009 status information only (2009 is the most recent available), see Table 2, version 3 below. Viewing the data this way may surprise you.

continue reading