
It’s only the 4th of December and Hudson Bay ice formation is way up over late 2000s coverage for this date — and higher than 2012, which had the lowest overall September ice extent for the Arctic since 1978.
This means boom times for Western and Southern Hudson Bay polar bears as sea ice formation is several days to a week ahead of last year. And as I mentioned in my last post, average November ice coverage across the Arctic this year was higher than 2003. Don’t forget that 2/3’s of the world’s polar bears live in Canada (see recent status update here; map below).
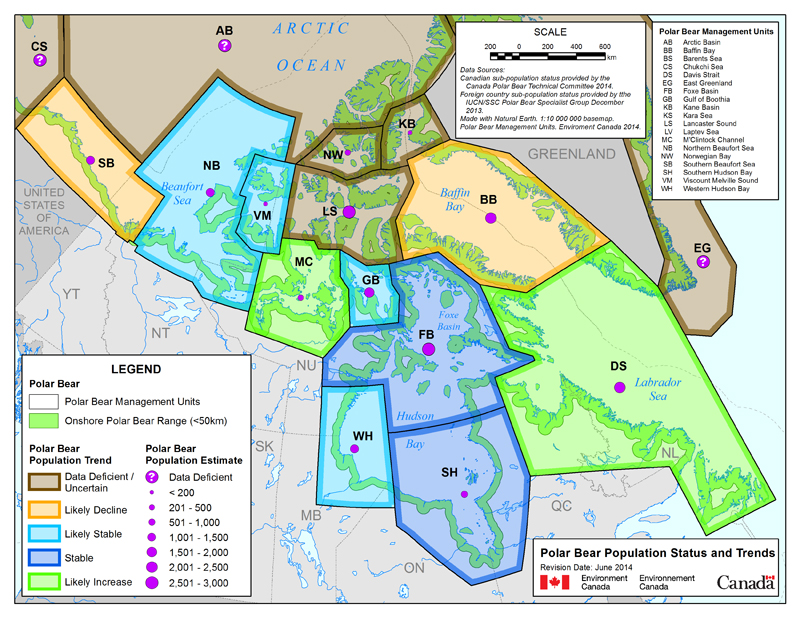
Polar bear population status in Canada. Courtesy Environment Canada.
More maps and charts below.
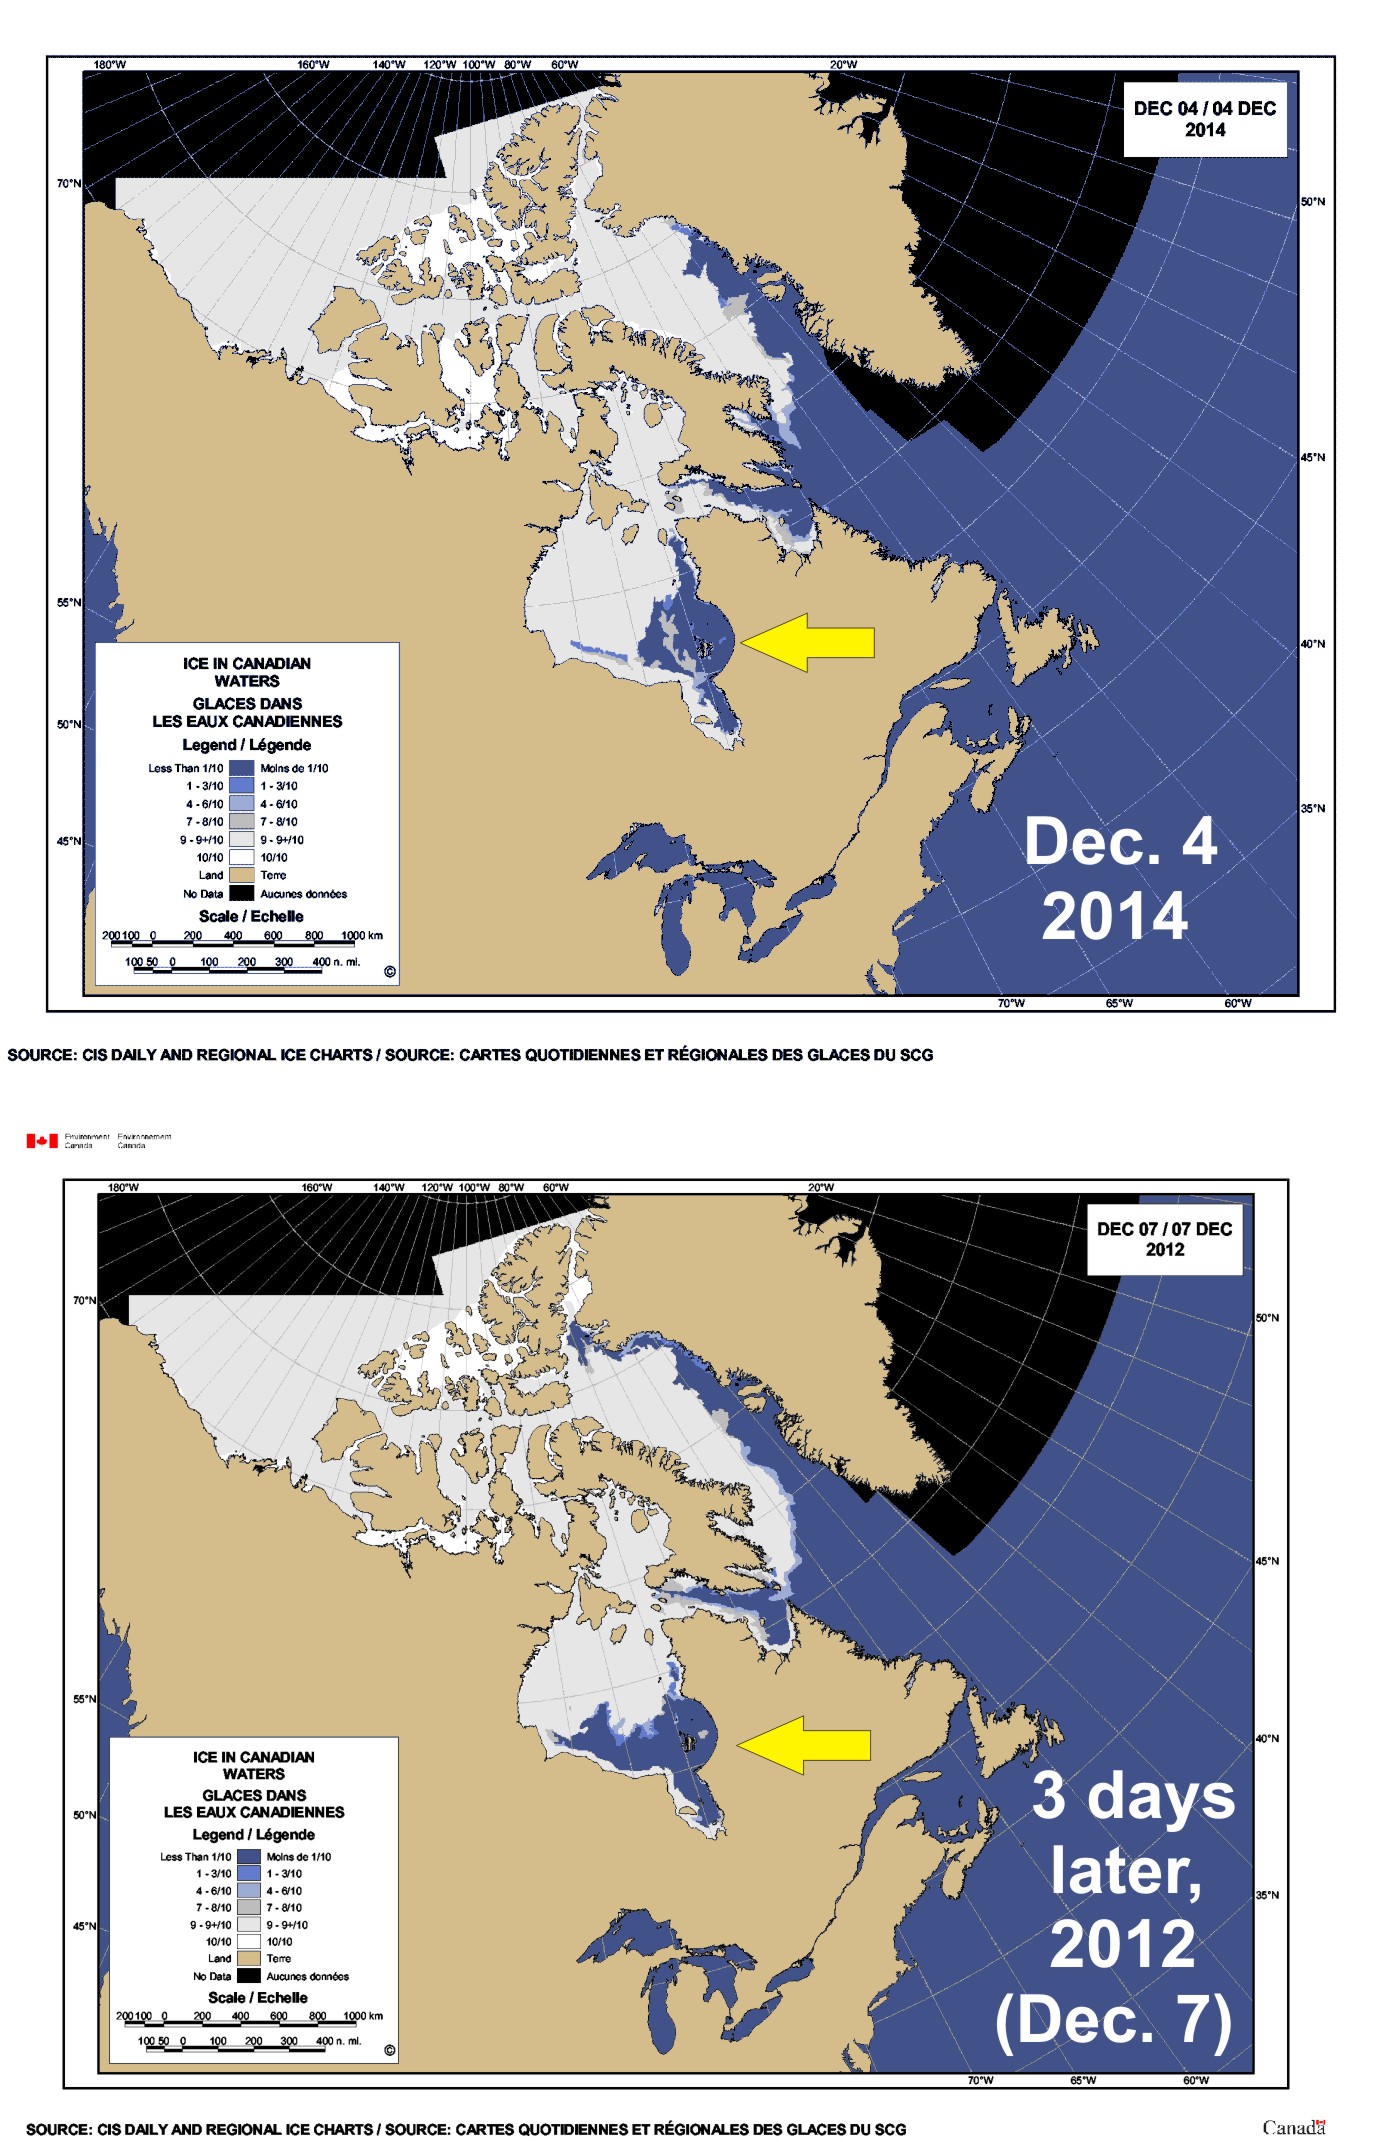
Canadian Ice Service (CIS) maps for early December 2014 vs. 2012: note that the only map I had for 2012 is for 7 December and yet it was still way behind the 4 December level seen this year.
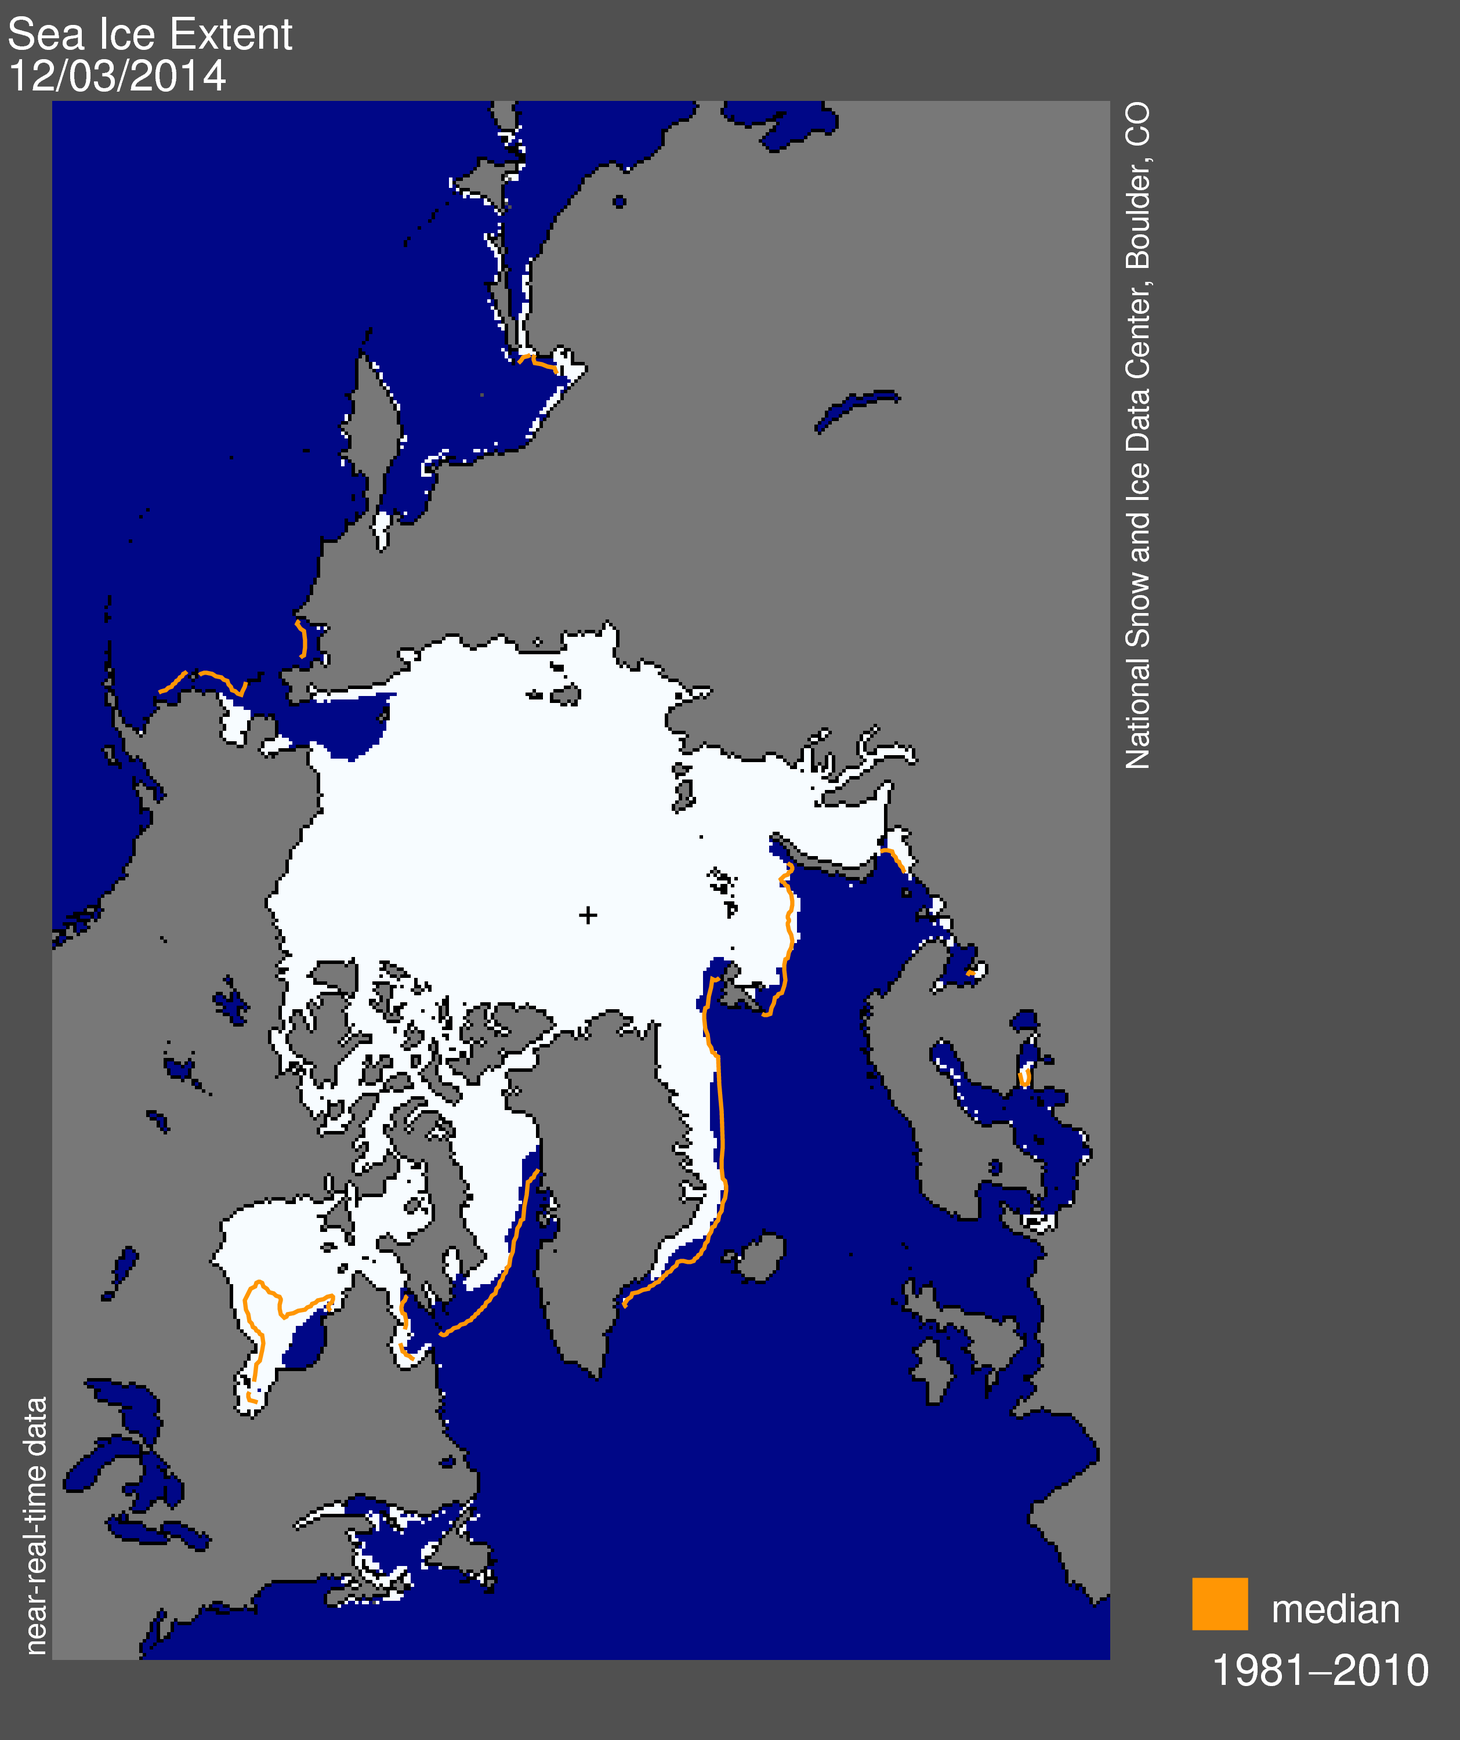
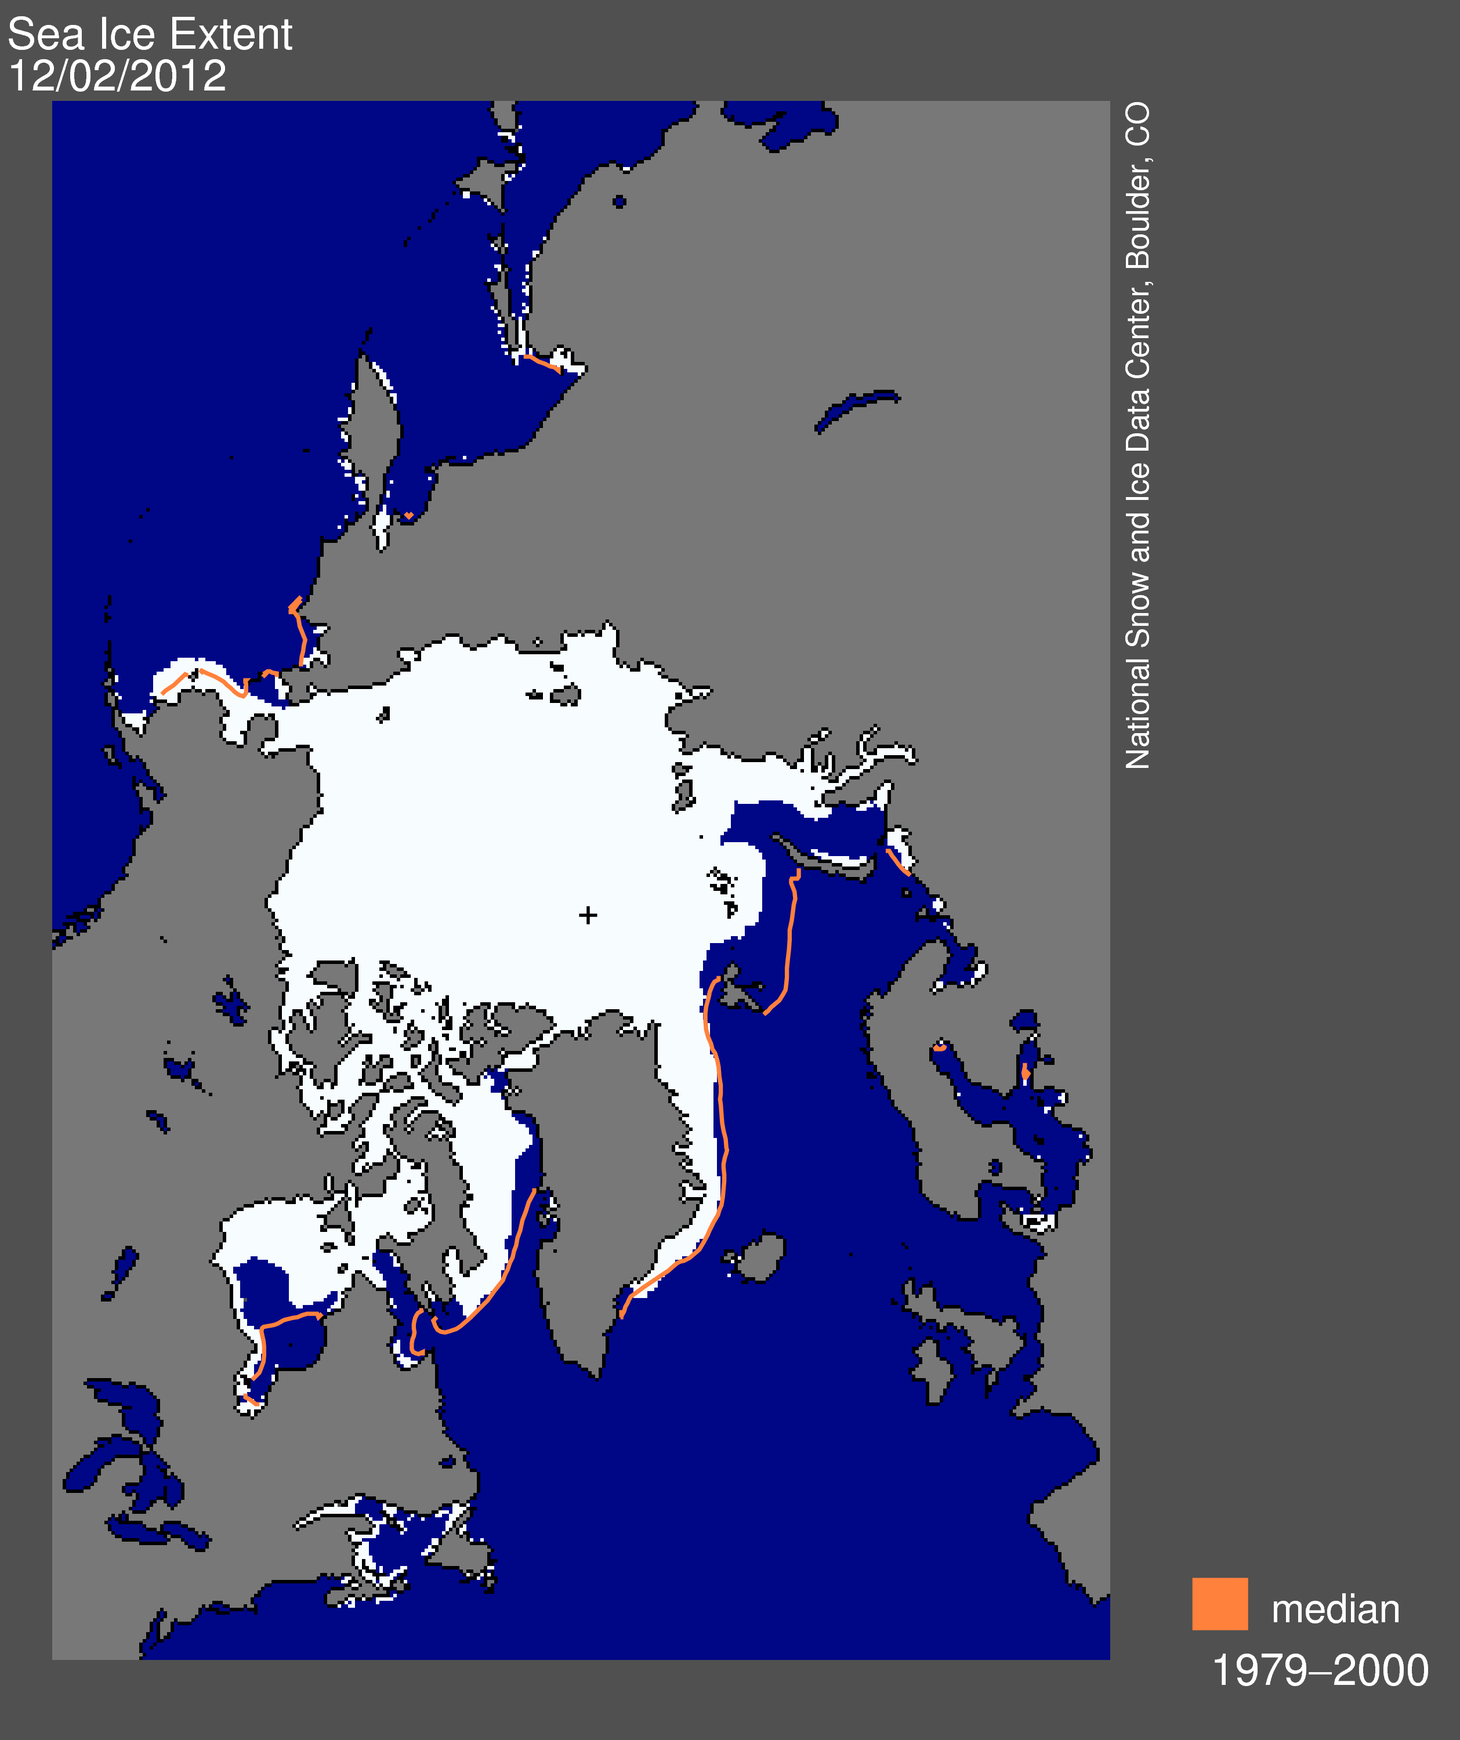
Ice maps from the National Snow and Ice Data Center (NSIDC) for December 3, 2014 and 2013 and for December 2, 2012.

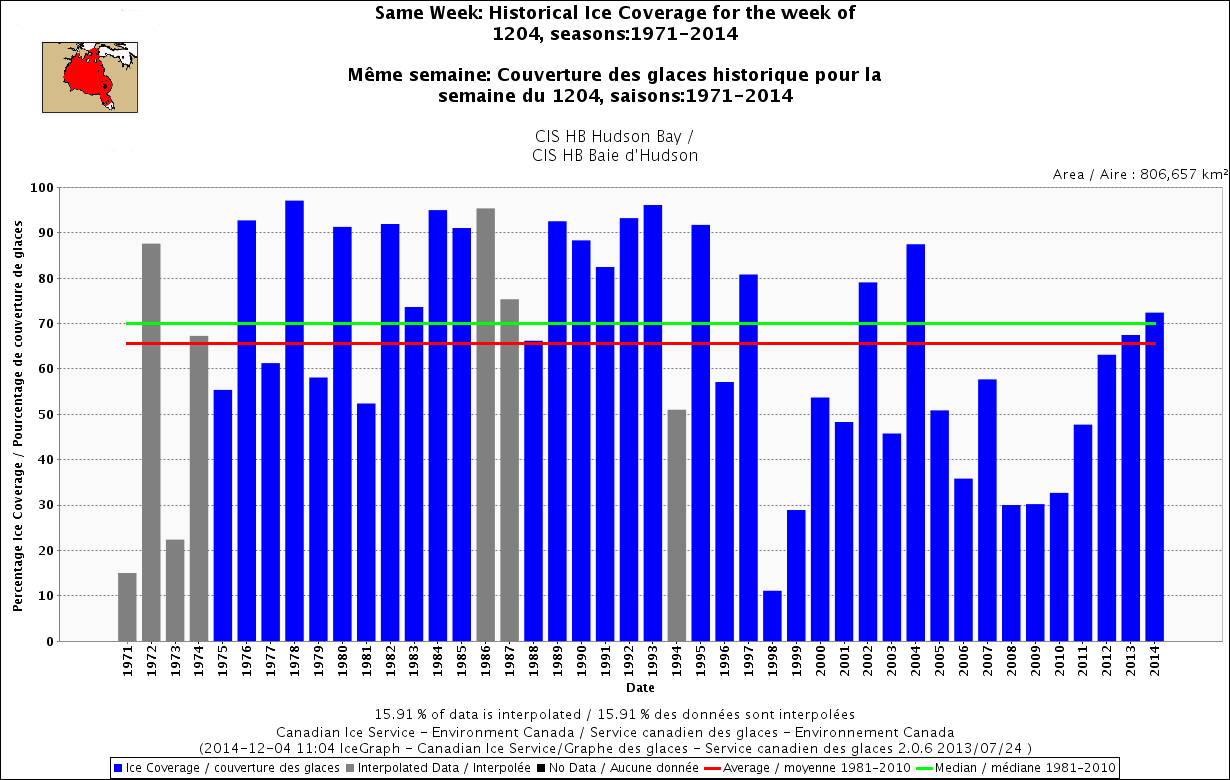
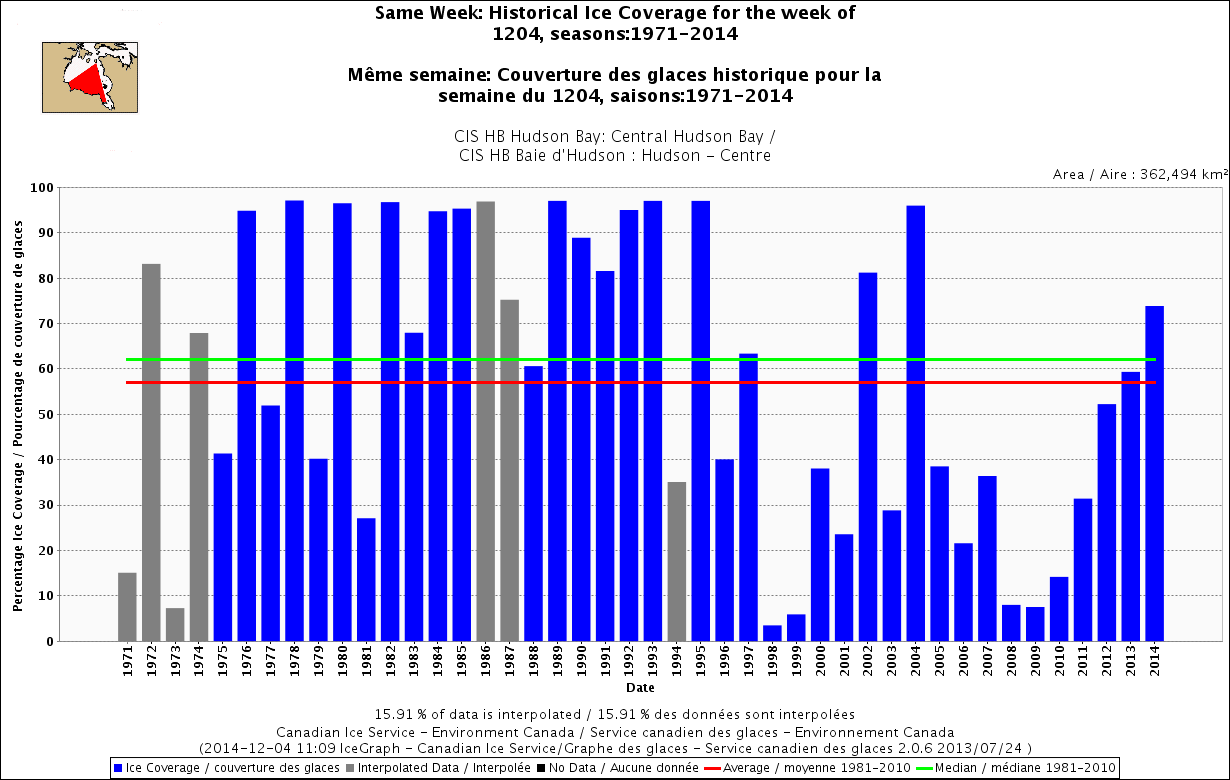
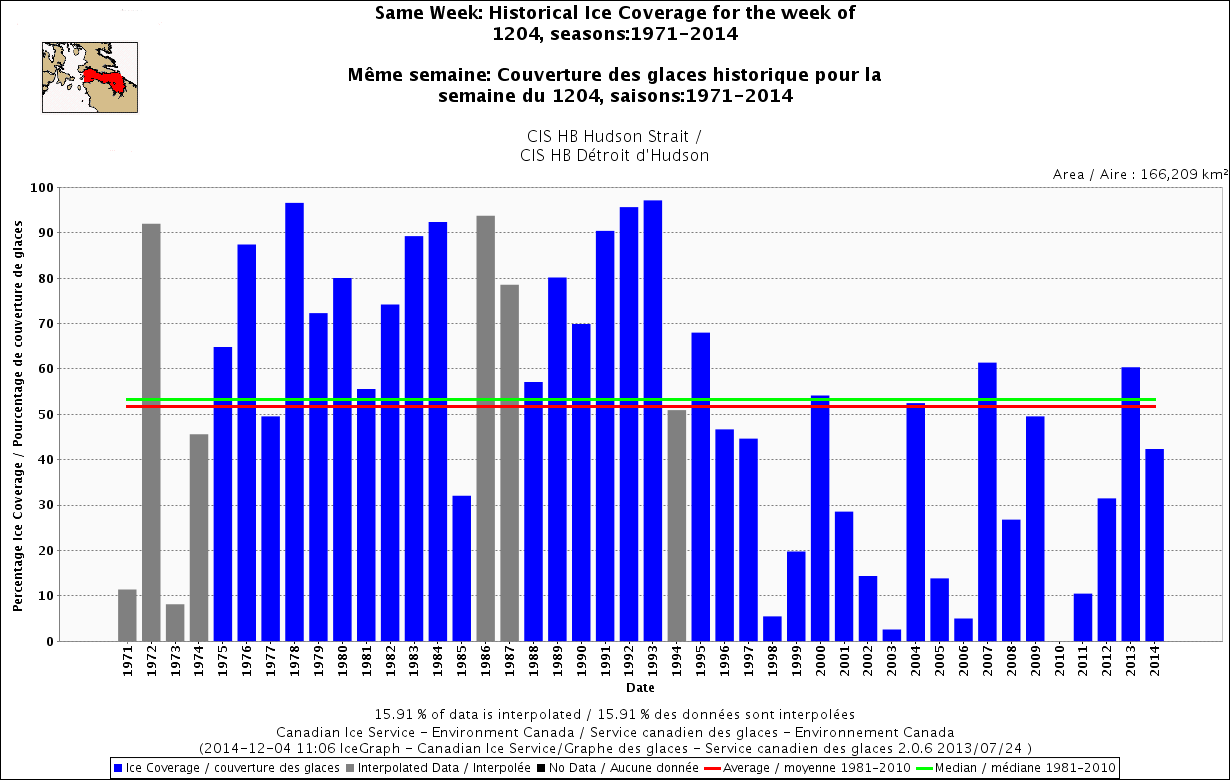
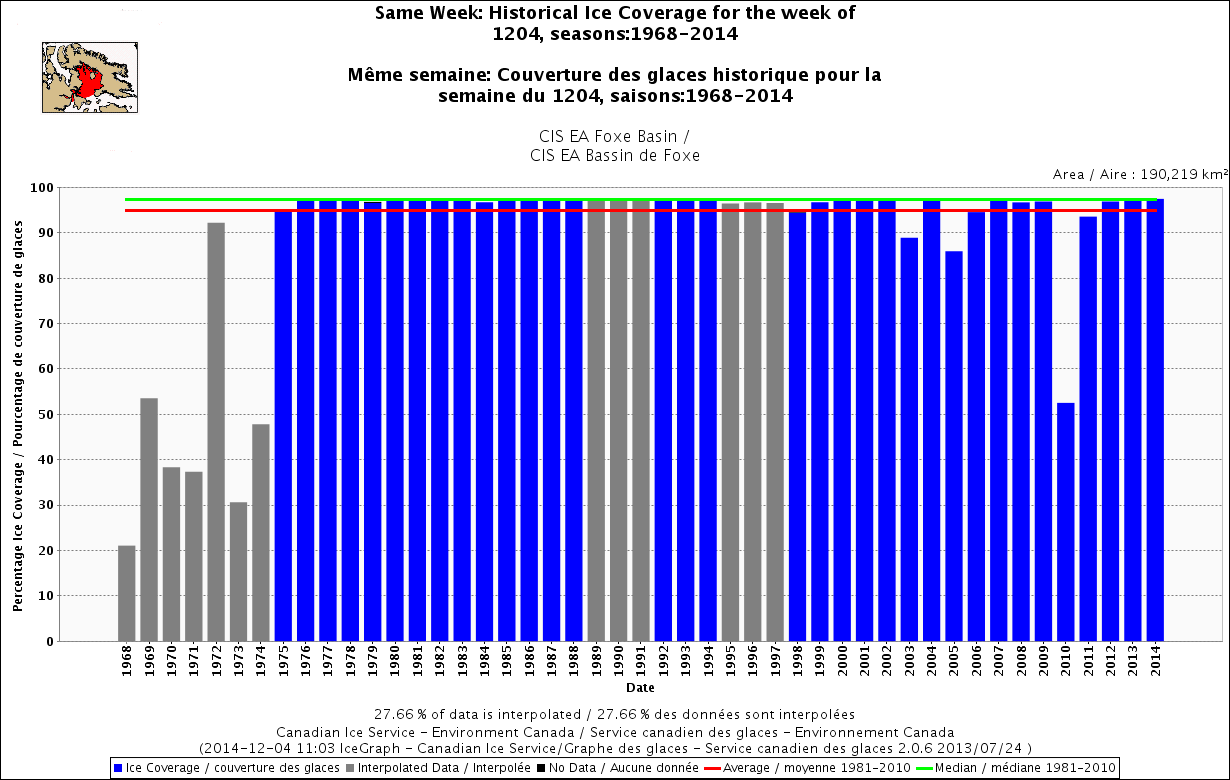
Below are some regional historical charts from CIS for the week of 4 December, either 1971-2014 or 1968-2014 (depending on the area), with both means and averages marked. See the inset maps upper left corner to see each region defined (click to enlarge).
Central Hudson Bay
Hudson Strait
Foxe Basin
Davis Strait (as noted earlier, well below average for this date)

Baffin Bay (a bit below average but not as low as it was from 1968-1974!)

Related post:
Hudson Bay freeze-up has not been a day later each year since 1981 November 22, 2013


You must be logged in to post a comment.