
Here is a bit of historical perspective for rational readers trying to make sense of the doom-mongering of others that current sea ice conditions spell trouble for polar bears, given that the winter maximum extent for 2017 reached a new seasonal low (keeping in mind that NSIDC does not publish error bars for these measurements, which helps elevate such pronouncements to “news”).
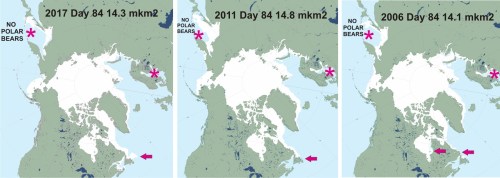
Ice extent (courtesy NSIDC’s MASIE) at 25 March (Day 84) is below for 2017, 2011 and 2006, almost 3 weeks after the winter maximum was declared at 7 March for 2017, 9 March for 2011, and 12 March for 2006. Extent at the maximum for 2006 was estimated at 14.68 mkm2, 14.42 mkm2 for 2017, and 14.67 mkm2 in 2011 (what tiny differences make headlines these days).
Remember: there are no polar bears in the Sea of Okhotsk or in the Baltic Sea (marked with an * below) yet ice in those regions is included in the Arctic totals used to determine maximum seasonal extent. Much (and sometimes, all) of the “Arctic” variation in extent at this time of year is accounted for by variation in Sea of Okhotsk and Baltic Sea coverage.
Bottom line: total winter ice extent for the Arctic ≠ winter polar bear habitat and neither have changed much in a decade.
See close up of the above graphic below.
2006 had less polar bear habitat than 2017 yet bears ultimately thrived!
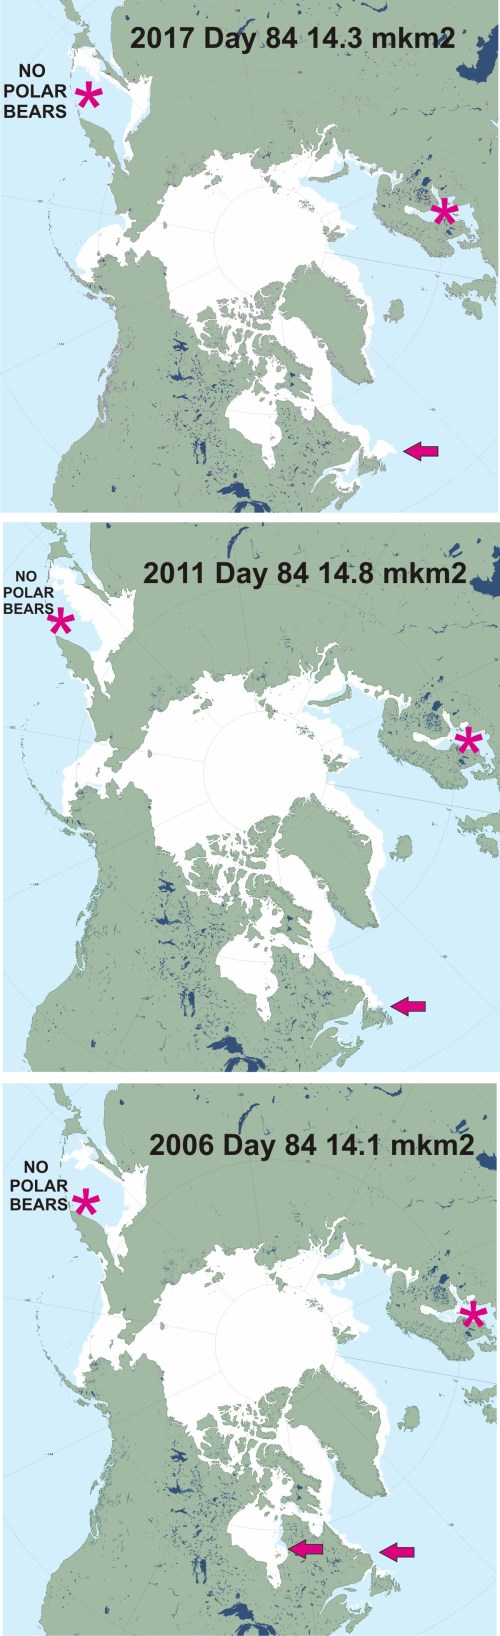 Sea ice was breaking up on 25 March in eastern Hudson Bay in 2006 (evident even in the above chart) and there was just a bit of sea ice off Labrador (map above, far right).
Yet, Davis Strait bears were surveyed the following year and found to have increased markedly since the previous survey – which means if late March ice had a negative impact on survival in 2006, it was not enough to offset the long-term increase (although it may have been enough to impact body condition in some bears).
Below is a graph of the March average extent for 1979-2016 (NOT the seasonal maximum but usually close), where the 2006 low stands out just as strongly as the drop in summer ice in 2007, discussed here. However, although there has been year-to-year variation, there has not been a further dramatic drop since then (the 2017 point yet to be determined of course but likely in the same ballpark as 2006, 2015, and 2016).
In other words, no trend since 2006.


You must be logged in to post a comment.