I’ve already commented on the 2013 update of polar bear population status released by the IUCN Polar Bear Specialist Group (PBSG).
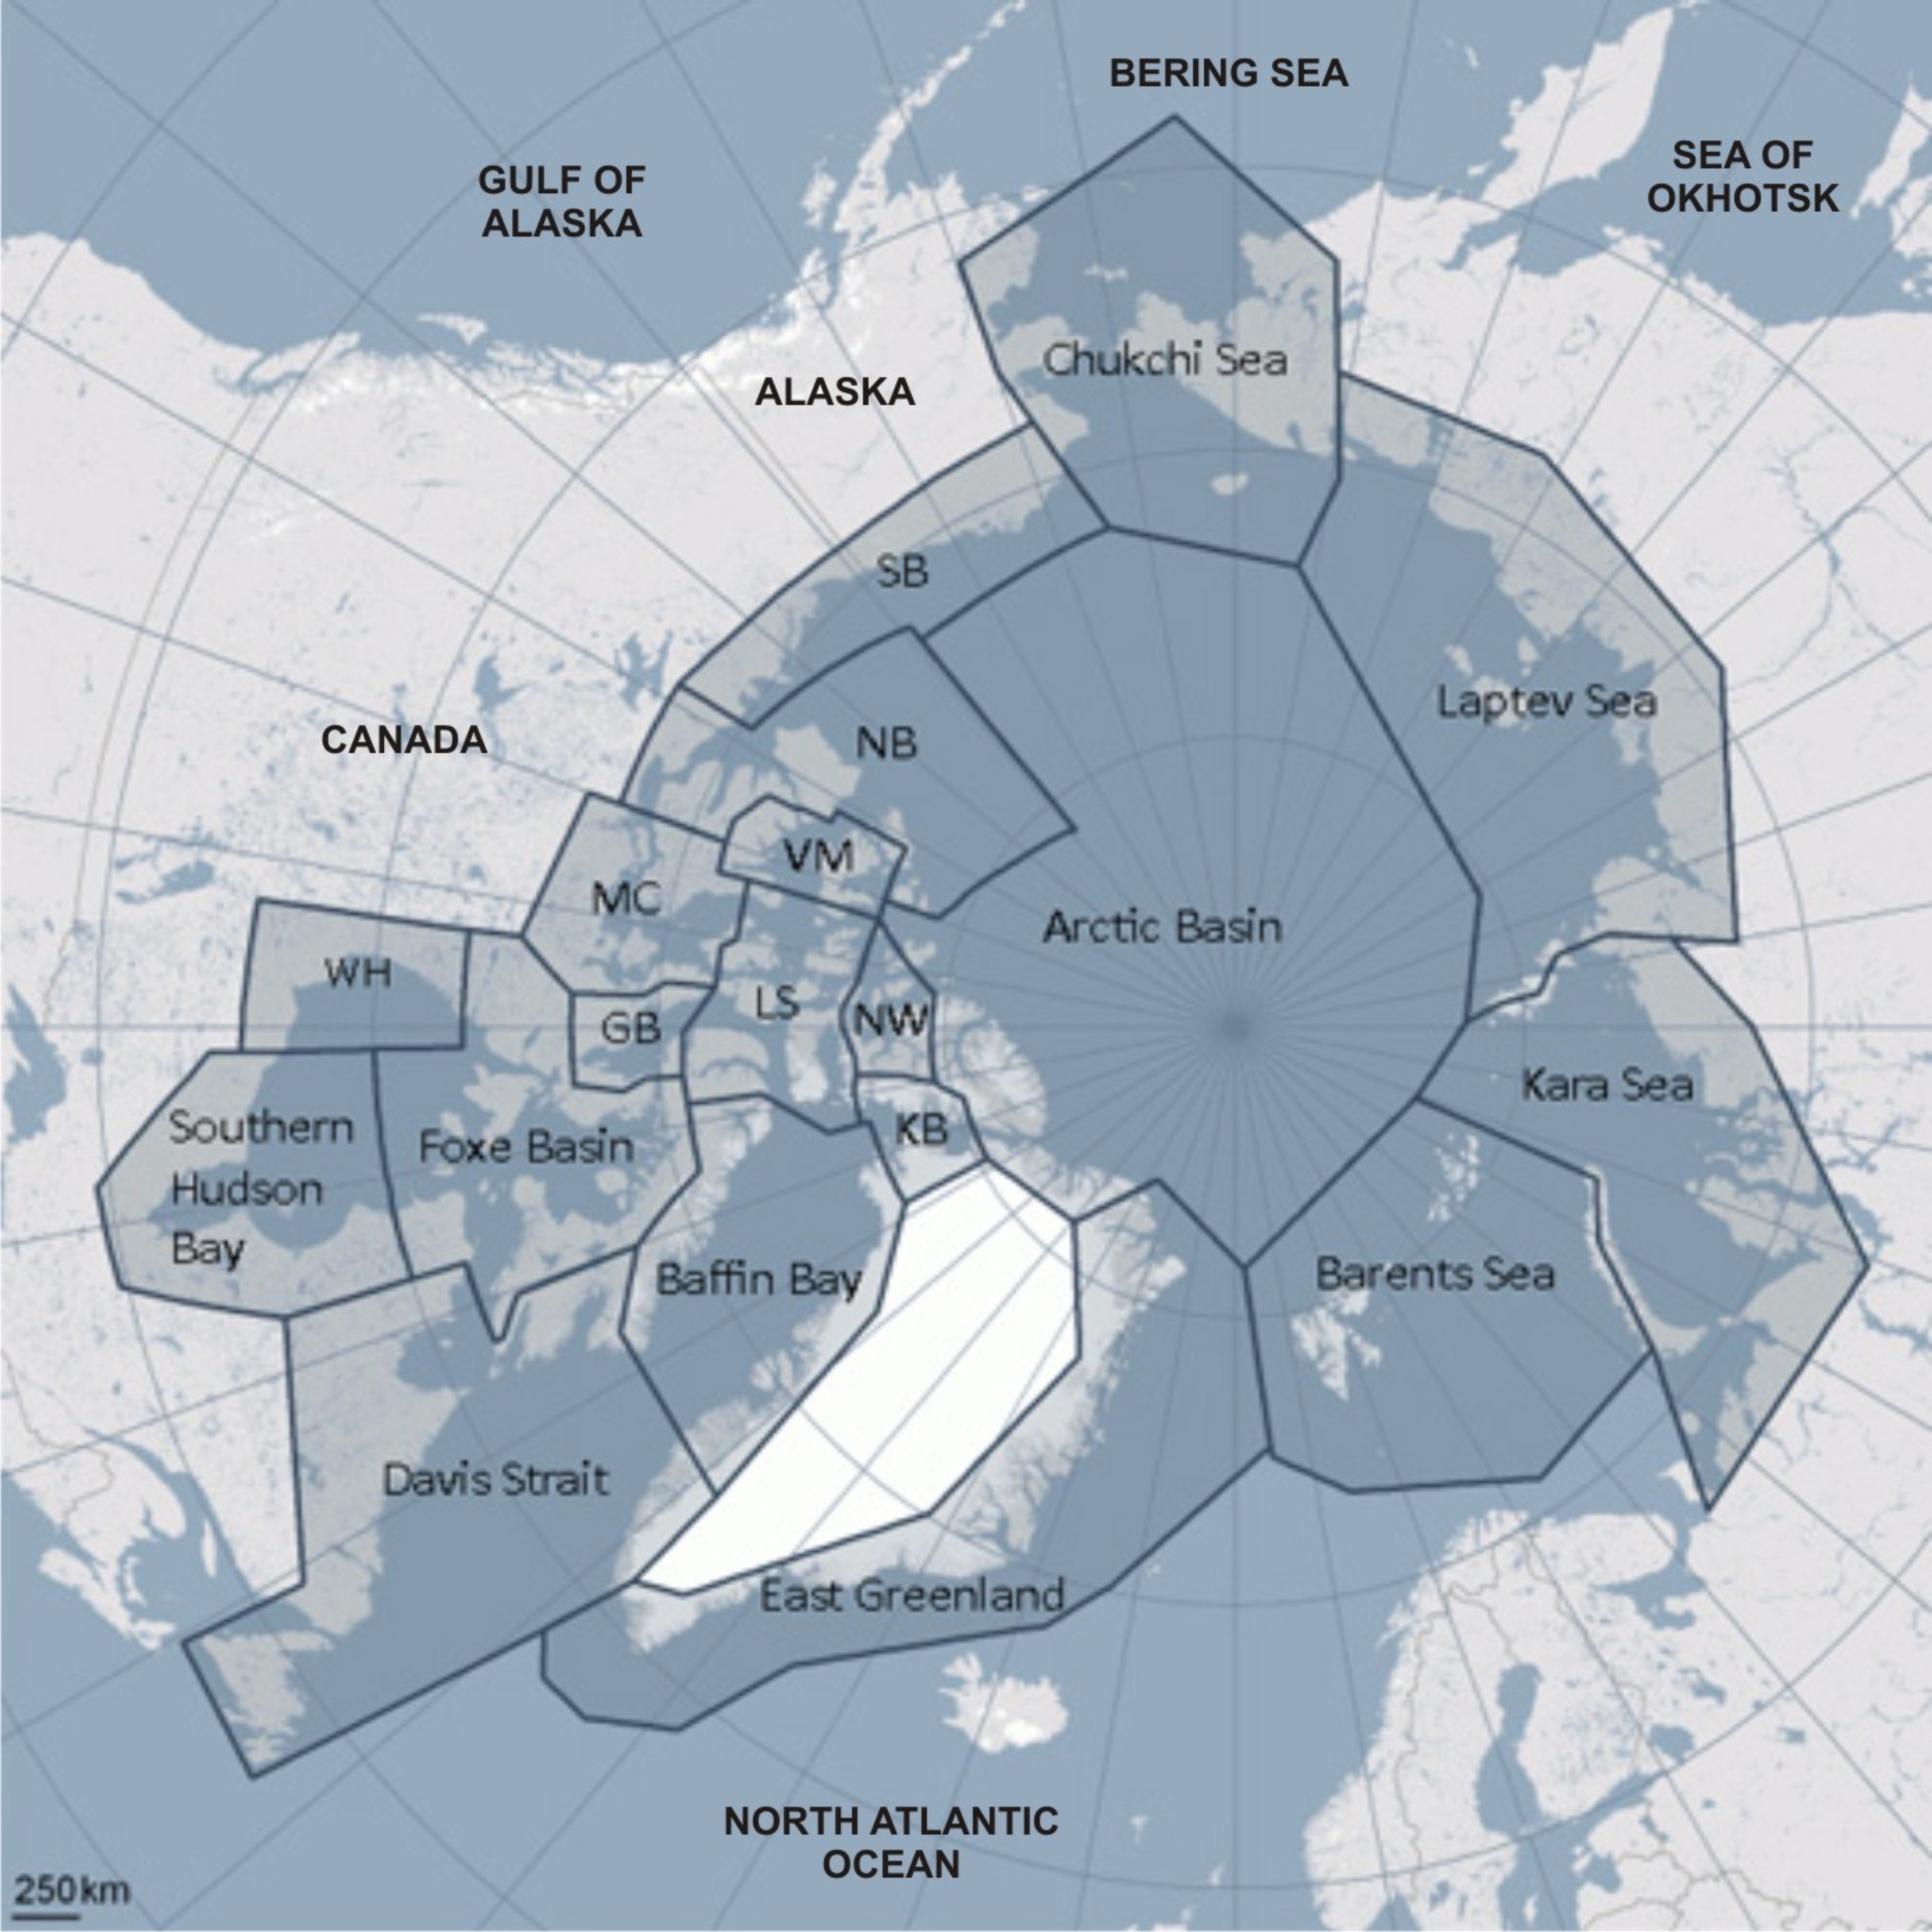
However, I thought it might be interesting to graph the changes in global population estimates over time (from 1981-2013) — not just the actual estimates from PBSG status tables (with their min/max error ranges) but those totals plus the so-called “inaccurate” estimates that the PBSG have dropped from their accounts in recent (2005-2013) assessments: Chukchi Sea, East Greenland, Queen Elizabeth Islands (now known as the “Arctic Basin”), and Laptev Sea.
In 2001, those “inaccurate” estimates contributed 5,000-5,400 bears to the global total, but now they’re gone — no bears from those regions contribute to the official totals listed on recent PBSG status tables.
Adding those dropped estimates back into the global totals makes it possible to generate a graph in which the global estimates are truly comparable over time.
To see how the dropped estimates influenced the perception of population change over time, I’ve also graphed the estimates given by the PBSG in their status tables. I’ve combined the two into one image (Fig. 1, click to enlarge) to make comparison easy.
UPDATE 5 December 2014: Links to more recent posts relevant to this issue added below. The most recent numbers, added 31 May 2015, are here.
UPDATE 26 March 2019: See “Latest global polar bear abundance ‘best guess’ estimate is 39,000 (26,000-58,000)”
Continue reading


You must be logged in to post a comment.