Tag Archives: climate models

UN awards Attenborough prize for his devotion to broadcasting climate breakdown nonsense

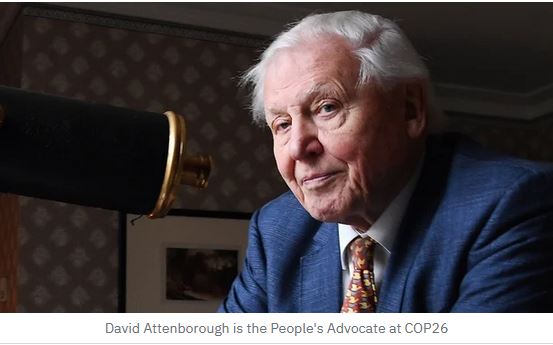
The UN Environmental Program (UNEP) last month presented Sir David Attenborough a ‘Champion of the Earth’ award for his devotion to frightening children and adults about the fake catastrophes of climate change. They didn’t put it quite like that, of course, but given their agenda promoting the scariest scenarios based on highly improbable climate models, it’s no wonder the UN is happy with Attenborough’s performances to advance their cause.

Too bad so little of what Attenborough promotes is actually true and that he gets away with it because the message comes with pretty pictures. Except for the Russian falling walrus, of course: that film footage was so awful many people were truly horrified at what they were being shown. Death after gruesome death, all in slow motion, crafted to deliver the greatest shock possible, all falsely blamed on climate change by Attenborough.

Back in 2019, when the WWF/Netflix walrus sequence from ‘Our Planet’ was released, its purpose was to ensure the votes for unified action (i.e., ‘success’) at the upcoming UN climate meeting (COP26). Rather than “giving people hope” about taking action on climate change, that particular film footage was meant to emotionally bully politicians into action, as I explain in my latest book, Fallen Icon. Too bad it failed.

Continue reading

IUCN polar bear specialists reject IPCC- supported forecasts of sea ice based on CO2

In case you missed it — or missed the significance of it — polar bear specialist Mitch Taylor correctly pointed out in his recent essay (a response to the New York Times article that appeared Tuesday (10 April) about the Harvey et al. (2018) BioScience paper) that the IUCN Polar Bear Specialist Group have given up using computer models of future sea ice extent based on rising CO2 levels supported by the IPCC.

Polar_Bear_male_Regehr photo_March 21 2010_labeled

Their latest assessment (Regehr et al. 2016) does not link polar bear survival models to climate modeled forecasts of Arctic sea ice decline but rather to an assumption that declines already documented will continue in linear fashion over this century.

This means that CO2 emissions blamed on human fossil fuel use is no longer directly tied to the predicted future decline of polar bear numbers: IUCN polar bear specialists simply assume that sea ice will continue to decline in a linear fashion with no cause attributed to that decline except the broad assumption that anthropogenic climate change is to blame for Arctic sea ice declines since 1979.

No wonder former USGS polar bear biologist Steve Amstrup never refers to this IUCN PBSG study: he and the organization that now employs him, Polar Bears International, are still firmly wedded to the concept that CO2 is the sea ice control knob.

Continue reading

Sea ice experts make astonishing admissions to polar bear specialists

Climate scientists specializing in future sea ice predictions made some remarkable statements to polar bear scientists at their last meeting – admissions that may really surprise you.

USFWS_PolarBearNews2013_pg5 labeled

Back on June 26 (reported here), the IUCN Polar Bear Specialist Group (PBSG) posted a summary of its last meeting. So, I was very surprised to find (while there looking for something else), that on 18 July 2014 they had added minutes from the meeting to that summary.

These minutes are a bonanza because among the juicy nuggets of information is a summary of what the three invited climate scientists from Colorado (Jennifer Kay, Mark Serreze, and Marika Holland) had to say and what questions were asked. While real transparency would have involved posting copies of the sea ice presentations and transcripts of the question and answer sessions, this is certainly better than nothing.
Continue reading

Amstrup’s comment on his starving polar bear article and my response

Steve Amstrup has left a comment below his January 20, 2014 “starving polar bears’ article at The Conversation, which I discussed in my last post.

I’ve copied his comment below and the response to his comment that I left this morning, which is copied below his. See the entire comment sequence here.
Continue reading

Nature acknowledges warming hiatus, but does not explain continued declines in Arctic sea ice

Although there have been jumps and dips, average atmospheric temperatures have risen little since 1998, in seeming defiance of projections of climate models and the ever-increasing emissions of greenhouse gases.” Jeff Tollefson, January 15, 2014, Nature. [open access]

The eminent science journal Nature has finally acknowledged that global average temperatures have not behaved as predicted by climate models over the last 16 years. [h/t A. Watts]

Note that predictions of future sea ice declines and associated predictions of future polar bear declines are totally dependent on these climate models.

Here’s my question: if global temperatures have basically flat-lined since 1998, why has Arctic sea ice continued to decline?

If average global temperatures govern Arctic sea ice behavior, why was 1998 (or the year after) not the lowest September sea ice extent reached over the last 30 years? Oddly, 2012 was the lowest September extent (see graphs below, from NSIDC).

Paradoxically, not only has sea ice continued to decline since 1998 – despite the hiatus in global warming – but since 1998, all but one polar bear populations have either increased in size, not declined, or are doing very well by other measures (see previous summary post, Polar bears have not been harmed by sea ice declines).

Sea ice extent graphs for September (which all the hysteria is about) compared to selected months from March, June and November. Ranges given are approximate; note the differences in scale for each graph. NSIDC graphs, colored labels added.

Sea ice extent graphs for September (which all the hysteria is about) compared to selected months from March, June and November. Ranges given are approximate; note the differences in scale for each graph. NSIDC graphs, colored labels added.

Continue reading