Tag Archives: trend

17 years of near-zero trend in September sea ice demolishes claim that more CO2 means less sea ice

If the hottest year ever can’t precipitate ‘ice-free’ conditions in September, what’s it going to take? Arctic sea ice failed to nose-dive again this year, undoubtedly disappointing expects who have been anticipating a ‘death-spiral’ decline for ages. Arctic sea ice hit its seasonal low sometime around mid-September this year and although the precise value hasn’t been published, the average September ice coverage will likely be about 4.2 mkm2 once it gets announced in early October.

This means we have now had 17 years of a near-zero trend for September sea ice, extending the nearly-flat trend NSIDC sea ice experts acknowledged four years ago. This surely busts a huge hole in the prevailing concept that more atmospheric CO2 causes less summer sea ice. Note that CO2 levels measured in August 2023 were 419.7 parts per million (ppm), compared to 382.2 in August 2007, a rise of 37.5ppm with no corresponding decline in summer sea ice (and vs. 314.2 ppm in 1960). Measured in metric tons, CO2 emissions due to fossil fuels rose from 31.1 billion in 2007 to 37.1 billion in 2021 (last year of data), again with no corresponding decline in summer sea ice.

Continue reading

Global polar bear population size is about 28,500 when updates are included

Polar bear numbers have risen since 2005, no matter how you look at it:

Svalbard polar bear Jon Aars_Norsk Polarinstitutt

USGS estimated 24,500 (average) polar bears in 2005.

IUCN estimated 26,500 (average of 22,000-31,000) in 2015
(assessment completed in July, released in November).

Subpopulation surveys completed or reported after July 2015 (Baffin Bay, Kane Basin, Barents Sea) added ~2,000 bears.

This brings the adjusted average total at 2015 to ~28,500.

This may not be a statistically significant increase but it is also not the catastrophic decline that was predicted to occur in association with the abrupt drop of summer sea ice in 2007 to a new average of about 3-5 mkm2 [updated 1 June 2017].

Crockford 2017_Slide 12 screencap

Explained in full in this published paper, pgs 20-21:

Crockford, S.J. 2017 V3. Testing the hypothesis that routine sea ice coverage of 3-5 mkm2 results in a greater than 30% decline in population size of polar bears (Ursus maritimus). PeerJ Preprints 2 March 2017. Doi: 10.7287/peerj.preprints.2737v3 Open access. https://doi.org/10.7287/peerj.preprints.2737v3

UPDATE 26 March 2019: See “Latest global polar bear abundance ‘best guess’ estimate is 39,000 (26,000-58,000)

Organizations fail to acknowledge 2015 Red List polar bear assessment info

You have to know that the 2015 IUCN Red List assessment for polar bears contains good news because no one is talking about it – and none of the online information sources I’ve checked have updated their polar bear profiles to reflect it.

For all its flaws (including the deceptive focus on summer sea ice), this Red List update is the most statistically robust, in-depth study of the conservation status of polar bears – why is it being ignored, especially by the conservation organizations people turn to for information online?

UPDATE: see 18 January 2016 post here.

Continue reading

IUCN Red List says global polar bear population is 22,000 – 31,000 (26,000)

The long-awaited 2015 IUCN Red List assessment for polar bears was released today (Wiig et al. 2015) and it includes some rather astonishing details − including the fact that the population trend is unknown.

polar_bear_usfws_no date_sm

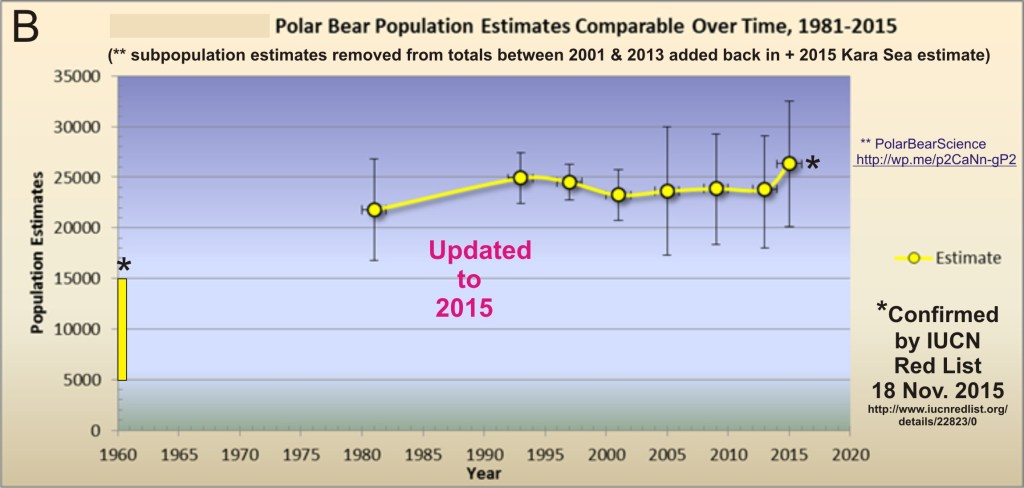
1) It confirms the global population size I published in May 2015 (20,129-32,558; average 26,344). See the graph below, now amended to reflect this point. If global numbers do decline over the next 35 years, it will be from a high point not previously acknowledged by the IUCN Polar Bear Specialist Group (PBSG).

Crockford OFFICIAL polar bear numbers to 2015_IUCN concurrs Nov 18

2) The current population trend is listed as: ? Unknown. [NOT declining – if anyone claims it is, send them here: IUCN Red List U. maritimus]

3) It puts the generation time for polar bears at 11.5 years (range 9.8-13.6), a huge drop from the 15 years used in previous predictive models. This change makes a big difference to the model results: three generations (the minimum period needed to show a trend) are now 35 years rather than 45 years.

4) It states there is a 70% chance of a 30% decline in polar bear numbers by 2050 and a 7% probability of a reduction > 50% if sea ice declines as predicted, but noted the large amount of uncertainty in these projections. That means there is a greater chance that numbers will not decline by 30% in the next 35 years (a 30% chance) than that the numbers will decline by 50% or more by 2050. That sounds like good news to me.

5) It will continue to list polar bears as Vulnerable. PBSG biologists managed to prevent polar bears from being listed as Least Concern or perhaps Near Threatened. But they had to give up a lot to get it.

6) The report supplement (Wiig et al. 2015 supppl.) explained why they did not calculate extinction probabilities and extinction is not mentioned at all on the IUCN Red List polar bear assessment page. This assessment only considers the probabilities of a decline in population size by 2050.

Yet, a spokesperson for the IUCN apparently stated (The Guardian, Climate change is ‘single biggest threat’ to polar bear survival; 19 November 2015 ) that:

“There is a high risk of extinction and the threat is serious,” said Dena Cator of the IUCN’s species survival commission. “You could consider polar bears to be a canary in the coal mine. They are an iconic and beautiful species that is extremely important to indigenous communities. But changes to their sea ice habitat are already being seen as a result of climate change.”

Apparently Dena Cator does not expect that people will read the report or find the assessment page on the IUCN Red List website – or she’s giving her personal opinion rather than explaining the report results. More on the points above and links to the report supplement pdf below, with quotes.
Continue reading

Western Hudson Bay polar bear numbers are stable, no trend in ice breakup or freeze-up

This needs saying again: the latest study on Western Hudson Bay polar bears reveal the population has been stable since 2004 and there has been no significant trend in either breakup or freeze-up dates since 2001.

Triplets in Wapusk NP from McCall webpage 2013

Environment Canada and the IUCN Polar Bear Specialist Group concur that the current size of the WHB subpopulation is about 1030 bears. Documents found online indicate a new version of the 2013 WHB mark-recapture report (Lunn et al. 2013) is now available (Lunn et al. 2014) and that a new population survey is planned for 2016. A 2013 story based on false information produced by The Guardian that is still in circulation should be retracted.
Continue reading