Tag Archives: estimate

Accepted sea otter population estimate at 1911 as inaccurate as rejected polar bear estimate for 1960s

Sea otter specialists, without shame or apology, routinely use a benchmark figure of ‘about 2,000’ for the pre-protection population size of the species at 1911 based on extremely limited evidence yet polar bear specialists refuse to accept a benchmark figure for the 1960s despite the existence of eight published estimates made by experts at the time. Sea otters came much closer to extinction than polar bears did and are not out of the woods yet, for reasons that are not entirely understood (Doroff et al. 2021).

Andrew Derocher, 22 February 2022: ‘There never was a population estimate of global abundance in the 1960s.’

Derocher’s statement and those of his colleagues, discussed at length in The Polar Bear Catastrophe That Never Happened, makes them look biased and unprofessional. There is absolutely no rational scientific justification for holding this stance.

Continue reading

Statement of polar bear population size estimates by polar bear scientists in 1965

Polar bear scientists in 1965 published a consensus statement on population size, with no caveats that these were ‘wild guesses’ or not to be taken seriously. They quoted some of the same authorities that I did when I suggested a plausible baseline figure. Andrew Derocher, Steven Amstrup and others who say there has never been population estimates for the 1960 or 1970s are not defending science, they are lying to protect their ‘polar bears are all gonna die because of climate change’ narrative. No other biologists do this, even those who insist the species they study are at risk from human-caused global warming. You should ask why.

This controversy is why archives like the one I created yesterday are so important: they make it impossible to re-write history as some insist on doing:

Continue reading

OK in the 80s but not now: ‘seeing more polar bears means there are more bears’

Wait for it, it will come: backlash from polar bear scientists for a statement by an Inuk bear safety guide in Labrador, reported by the CBC yesterday. The guide said there are more polar bears now than there were 25 years ago based on the fact that he is seeing more bears and that more bears mean more trouble with bears, including attacks on people. As I point out in my new book, The Polar Bear Catastrophe That Never Happened, only in the 1980s did biologists admit that seeing more bears meant there were actually more bears.

polar-bear-black-tickle_Edwin Clark submitted to CBC no date

This bear visited Black Tickle in Labrador a few years back. Edwin Clark photo.

It has not been OK anywhere else in the world over the last few years to suggest that seeing more bears meant more bears, whether you were Inuk or not – whether describing a subpopulation that’s officially ‘increasing’ or not.

According to biologist Andrew Derocher (University of Alberta), who famously said last year that ‘you can’t equate seeing more bears with there being more bears,’ all of the increased sightings and problems with bears in Labrador and Newfoundland are due to poor ice conditions. His colleague Ian Stirling (also University of Alberta) similarly puts the blame for increased polar bear/human conflicts and fatal attacks in Nunavut on a ‘shortage of ice‘. For polar bear specialists, it’s always ‘less ice‘, never ‘more bears.’

Continue reading

Latest global polar bear abundance ‘best guess’ estimate is 39,000 (26,000-58,000)

It’s long past time for polar bear specialists to stop holding out for a scientifically accurate global estimate that will never be achieved and determine a reasonable and credible ‘best guess’. Since they have so far refused to do this, I have done it for them. My extrapolated estimate of 39,000 (range 26,000-58,000) at 2018 is not only plausible but scientifically defensible.

Polarbear1_wikimedia_Andreas Weith photo Svalbard sm

In 2014, the chairman of the IUCN Polar Bear Specialist Group (PBSG) emailed me to say that their global population size number ‘has never been an estimate of total abundance in a scientific sense, but simply a qualified guess given to satisfy public demand.’

In my new book, The Polar Bear Catastrophe That Never Happened, I contend that this situation will probably never change, so it’s time to stop holding out for a scientifically accurate global estimate and generate a reasonable and credible ‘best guess’. Recent surveys from several critical polar bear subpopulations have given us the information necessary to do this.

UPDATE: I have made this a sticky post for a while: new posts will appear below.

Continue reading

Polar bear numbers, margins of error, & consequences for conservation status

Large margins of error in polar bear population estimates means the conservation status threshold of a 30% decline (real or predicted) used by the US Endangered Species Act and the IUCN Red List is probably not valid for this species.

Polar_Bear_Biologist_USFWS_working_with_a_Bear_Oct 24 2001 Amstrup photo

Several recent subpopulation estimates have shown an increase between one estimate and another of greater than 30% yet deemed not to be statistically significant due to large margins of error. How can such estimates be used to assess whether population numbers have declined enough to warrant IUCN Red List or ESA protection?

What do polar bear population numbers mean for conservation status, if anything?

Continue reading

Breaking: 2016 W. Hudson Bay polar bear survey shows the population is still stable

A just-released report on the most recent (2016) survey shows Western Hudson Bay polar bear numbers were still stable despite predictions that this subpopulation would be wiped out completely (reduced to zero) due to low Arctic sea ice.

Churchill_Polar_Bear_2004-11-15 Wikipedia

The authors of the report on the August 2016 aerial survey of the Western Hudson Bay polar bear subpopulation (Dyck et al. 2017) state clearly that the only trends they could find were that the number of adult males increased somewhat over 2011 estimates and the number of females either declined or remained stable. The overall population estimate was a bit lower (11% less) compared to the 2011 survey but the difference is not statistically significant. Therefore, the population status must be stable.

2011 estimate: 949 bears (using comparable data, range 618-1280), litter size 1.43

2016 estimate: 842 bears (using comparable data, range 562-1121), litter size 1.63

[cf. Foxe Basin [stable], from 2009-2010 survey (Stapleton et al. 2016) litter size was 1.54]

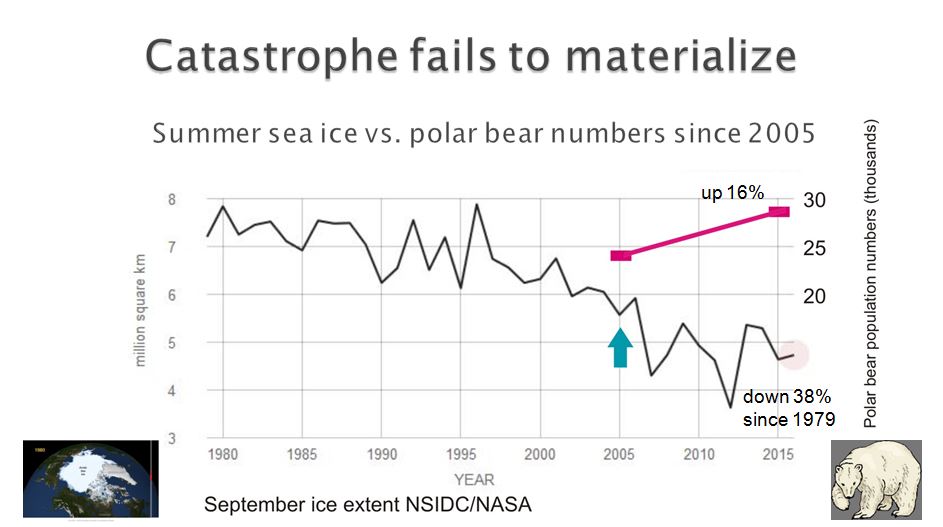
An 11% decline in WH numbers since 2011 is most definitely NOT the decline to ZERO (extirpation) we were told to expect with Arctic sea ice as low as it has been since 2007 (Crockford 2017, see list of annual minimum extents 2007-2017 here).

Note: The percentage decline from 2011 to 2016 for Western Hudson Bay polar bears is 11%, NOT 18% as claimed recently by Andrew Derocher on twitter: it is not appropriate to compare the official 2011 estimate of 1030 (Stapleton 2014) to the 2016 estimate of 842 because the methods used to generate the estimates were different (Dyck et al. 2017). The authors of the report state that the estimate for 2011 that’s comparable to 2016 is 949.

An 11% decline from 1030 would be 917 bears, a statistically insignificant decline that is also biologically insignificant and therefore, so slight as to indicate a stable population.

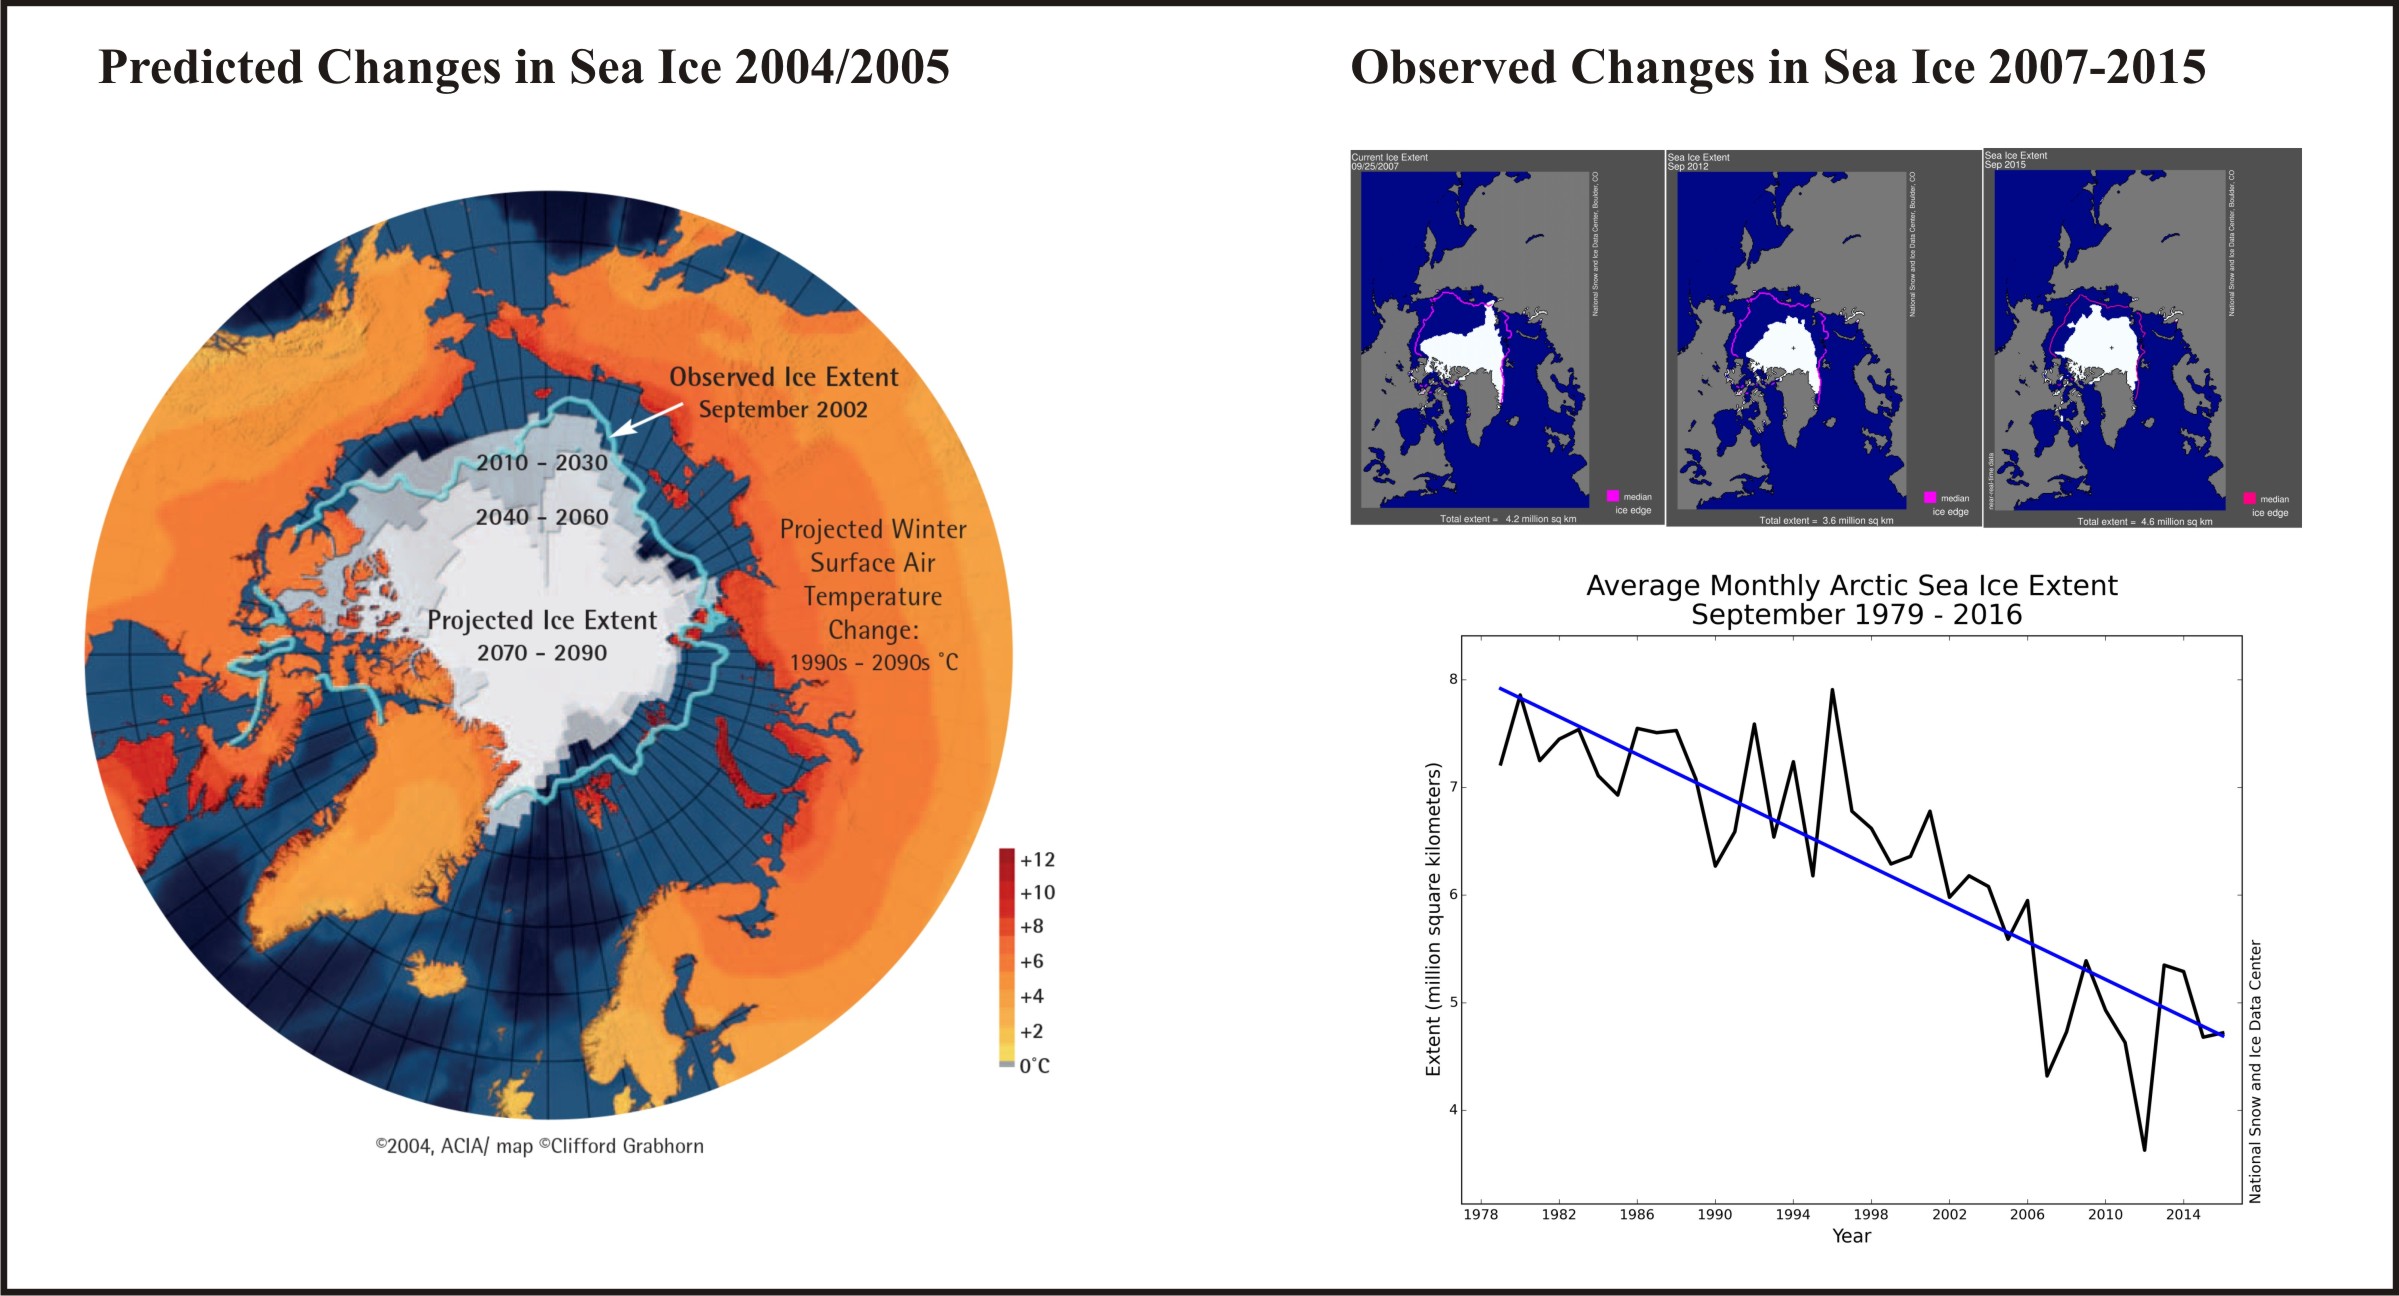
Predicted sea ice at 2050 and 2080 shown below (see Crockford 2017 for details):

Crockford 2017 sea ice graphic

Quotes, map, and table from the Dyck et al. 2017 report (pdf here) are copied below.

Continue reading

Global polar bear population size is about 28,500 when updates are included

Polar bear numbers have risen since 2005, no matter how you look at it:

Svalbard polar bear Jon Aars_Norsk Polarinstitutt

USGS estimated 24,500 (average) polar bears in 2005.

IUCN estimated 26,500 (average of 22,000-31,000) in 2015
(assessment completed in July, released in November).

Subpopulation surveys completed or reported after July 2015 (Baffin Bay, Kane Basin, Barents Sea) added ~2,000 bears.

This brings the adjusted average total at 2015 to ~28,500.

This may not be a statistically significant increase but it is also not the catastrophic decline that was predicted to occur in association with the abrupt drop of summer sea ice in 2007 to a new average of about 3-5 mkm2 [updated 1 June 2017].

Crockford 2017_Slide 12 screencap

Explained in full in this published paper, pgs 20-21:

Crockford, S.J. 2017 V3. Testing the hypothesis that routine sea ice coverage of 3-5 mkm2 results in a greater than 30% decline in population size of polar bears (Ursus maritimus). PeerJ Preprints 2 March 2017. Doi: 10.7287/peerj.preprints.2737v3 Open access. https://doi.org/10.7287/peerj.preprints.2737v3

UPDATE 26 March 2019: See “Latest global polar bear abundance ‘best guess’ estimate is 39,000 (26,000-58,000)

Global polar bear population larger than previous thought – almost 30,000

The results of three recently-released studies that were not included in the last IUCN Red List assessment add more than 2,050 bears (on average)1 to the official 2015 global polar bear estimate, a point you won’t likely hear next Monday (27 February) from most polar bear specialists, conservation organizations, their cheerleaders and corporate sponsors on International Polar Bear Day.

global-pb-population-size-graphic2_2017-feb-polarbearscience-corrected

This means the adjusted 2015 global estimate for polar bears should be about 28,500 (average), a marked increase over the official estimate of 26,500 (average) for 2015 — and an even larger increase over the 2005 estimate of about 22,500 (average)2, despite the dramatic loss of summer sea ice since 2007 that we hear about endlessly.

It is increasingly obvious that polar bears are thriving despite having lived through summer sea ice levels not predicted to occur until 2050 – levels of sea ice that experts said would wipe out 2/3 of the world’s polar bears (Amstrup et al. 2007; Crockford 2017 v3).

Update 26 March 2019: see “Latest global polar bear abundance ‘best guess’ estimate is 39,000 (26,000-58,000)

Updated 1 June 2017:  see addition to Footnote 2.
Continue reading

Polar bear capital of the world stuck between fear-mongering and science

CBS News published a predictably one-sided “Cover Story” this morning (14 February 2016) about Churchill, Manitoba – the self-proclaimed Polar Bear Capital of the World. 

This is the online version of a Sunday morning TV special that’s not available where I live. It’s yet another example of how the media feeds the politics of polar bears and prevents the advancement of science. Here’s my take on this CBS effort.

Amstrup vs IUCN science_Feb 14 2016_PolarBearScience

Continue reading

Survey Results: Svalbard polar bear numbers increased 42% over last 11 years

Results of this fall’s Barents Sea population survey have been released by the Norwegian Polar Institute and they are phenomenal: despite several years with poor ice conditions, there are more bears now (~975) than there were in 2004 (~685) around Svalbard (a 42 30% increase) and the bears were in good condition.

Svalbard polar bear fall 2015_Aars

Oddly, in a September report right after the count, biologist Jon Aars reported them in “excellent” condition, with some of them “as fat as pigs.” I guess “good” is the same as “excellent.”

Bears in the Russian portion of the Barents Sea were not counted this year because the Russians would not allow it; the previous total count, from 2004, was 2,650 (range ~1900-3600) for the entire region.

map-BarentsSea

In the map above (courtesy the IUCN Polar Bear Specialist Group), the Svalbard archipelago is on the left (Norwegian territory) and the archipelagos of Franz Josef Land and Novaya Zemlya on the right (Russian territory).

Oddly, the comments made by lead researcher Jon Aars to a Norwegian newspaper (in English), which picked this up yesterday (“Polar bears make a comeback” ), were far more positive than those in the press release (which is likely all that western media will see).

UPDATE 24 December 2015: The new population survey number for Svalbard is actually a 42% increase over the 2004 number. Thanks to Arvid Oen, a WUWT reader, for alerting Anthony Watts to the error, and to Anthony for passing it along. Title and text fixed accordingly, apologies to any others who have picked this up. Cheers and Merry Christmas.

Continue reading