
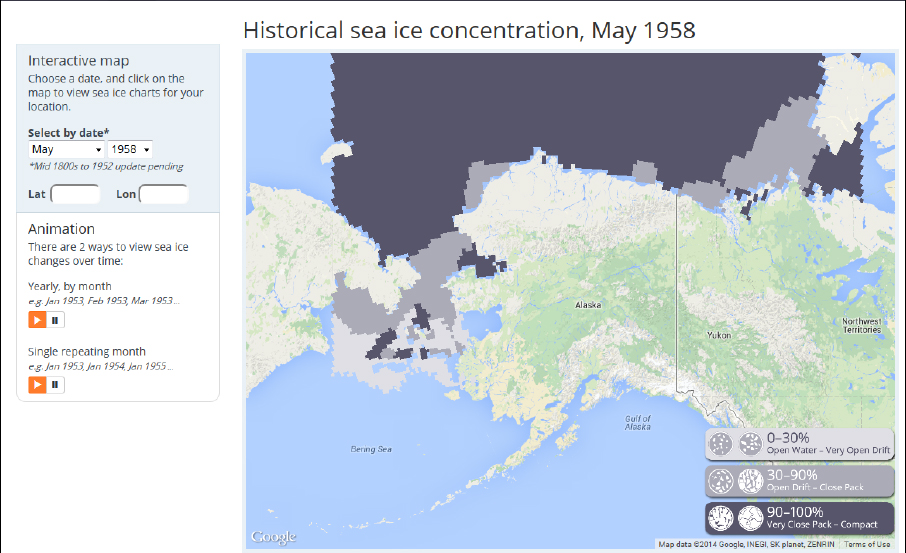
University of Alaska Fairbanks (UAF) is offering a new interactive sea ice map (which they call an atlas), that looks interesting and potentially useful, announced at Alaska Dispatch over the weekend (January 25, 2014: “New sea ice map offers a long-term look at climate change”).
At the moment, the years and months available include January 1953 to December 2012. Oddly, 2013 data is not included. The sea ice atlas charts polar bear habitat for the Southern Beaufort and Chukchi Sea subpopulations (including the Bering Sea), as well as the western portion of the Northern Beaufort Sea subpopulation region.
They say that by February 18, 2014, the atlas will include data from the mid-1800s to 1952. I expect that data will be available for only some months and some years for that period, but I could be wrong. They don’t say when data from 2013 will be added.
They don’t come right out and say that the purpose of the atlas is to promote the concept that anthropogenic global warming is to blame for recent changes in the ice levels. But the Alaska Dispatch article includes some telling quotes from John Walsh, UAF research professor and the project coordinator:
“The research shows the dramatic effect of a warming planet.
What stands out is that these last five or six summers are unique in the whole record in terms of ice retreat north of Alaska,” said Walsh, with the Alaska Center for Climate Assessment and Policy at UAF. “In the past, there was an occasional year where the ice edge goes several hundreds of miles offshore.” [like 1958, 1973, 1977, 1978] Those measurements were taken in September, when sea ice is at its minimum. But that didn’t happen year after year, as it has lately. “This seven-year period is unprecedented in the 160 years of data we’ve got,” Walsh said.” [my bold]
Note the emphasis Walsh puts on September levels, which are really irrelevant for polar bears, as I’ve pointed out before.
Walsh continues:
“The project drew on a variety of sources, including the reports from whaling ships. The lion’s share of the work involved digitizing historical documents. Those documents will be available for download for anyone who wants to dig deeper into the data, Walsh said.” [my bold]
So, it’s worth a look — see for yourself how variable Alaska sea ice has been, season by season, since 1953. Just keep in mind that all data prior to 1979 is not really comparable to satellite era data (1979-present) – see this pdf copy of the “Sources of sea ice data used in this Atlas.”
Some relevant posts you might want to check out:
Ten out of ten polar bears being tracked this summer in the Beaufort Sea are on the ice August 29, 2013
Tracking polar bears in the Beaufort Sea: September map October 17, 2013 [and every other month until December 2013, posted early the following month]
Why is it that every decade, Eastern Beaufort sea ice gets really thick? June 28 2013
Extirpated polar bears of St. Matthew Island spent five months on land during the summer January 21, 2013
How and why great news about Chukchi polar bears has been suppressed
September 8, 2013
Record sea ice loss in 2007 had no effect on polar bears, Chukchi study confirms September 15, 2013
Where were the appeals to feed starving polar bears in 1974? February 21, 2013


You must be logged in to post a comment.