
“Our results suggest that mark–recapture estimates may have been negatively biased due to limited spatial sampling. We observed large numbers of bears summering in southeastern WH, an area not regularly sampled by mark–recapture.” Stapleton et al. 2014.
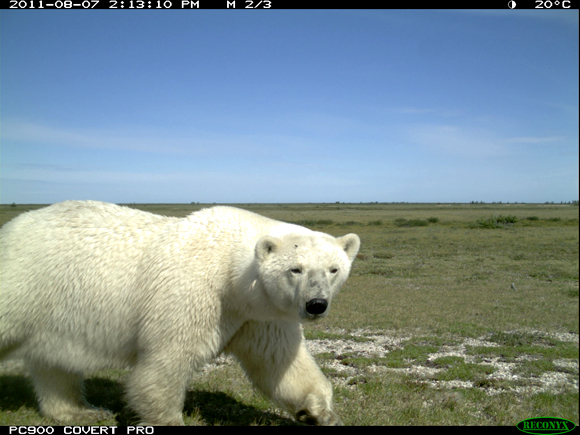
Polar bear at Wapusk National Park in August 2011. Courtesy Parks Canada.
We’ve seen the results of this 2011 study before, in government report format. But now it’s been revamped, peer-reviewed and published in a respected scientific journal – it actually came out in February, without fanfare, but I’ve only just come across it.
Some excerpts below, with conclusions that should raise some eyebrows.
THE PAPER
Stapleton S., Atkinson, S., Hedman, D., and Garshelis, D. 2014. Revisiting Western Hudson Bay: using aerial surveys to update polar bear abundance in a sentinel population. Biological Conservation 170:38-47. http://www.sciencedirect.com/science/article/pii/S0006320713004618#
THE ABSTRACT
“Capture-based studies of the Western Hudson Bay (WH) polar bear population in Canada have reported declines in abundance, survival, and body condition, but these findings are inconsistent with the perceptions of local people. To address this uncertainty about current status, we conducted a comprehensive aerial survey of this population during August, 2011, when the region was ice-free and bears were on shore. We flew a combination of overland transects oriented perpendicular to the coastline, coastal transects parallel to shore, and transects across small islands. We used distance sampling and sight–resight protocols to estimate abundance. Bears were concentrated along the coast in central and southern Manitoba and Ontario portions of the population, although sightings >10 km inland were not uncommon in central Manitoba. We analyzed 2 combinations of data and derived an abundance estimate of 1030 bears (95% CI: ∼754–1406). This figure is similar to a 2004 mark–recapture estimate but higher than projections indicating declining abundance since then. Our results suggest that mark–recapture estimates may have been negatively biased due to limited spatial sampling. We observed large numbers of bears summering in southeastern WH, an area not regularly sampled by mark–recapture. Consequently, previous mark–recapture estimates are not directly comparable to our aerial survey of the entire population. Whereas our results do not necessarily contradict the reported declines in this population, we believe that improvements are needed in monitoring, and methodological limitations and inconsistencies must be resolved to accurately assess status and the impacts of climate change.”
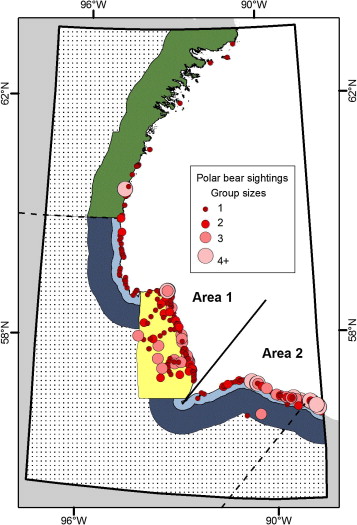
From the paper: “Figure 3. Polar bear sightings recorded during the Western Hudson Bay aerial survey, August, 2011.”
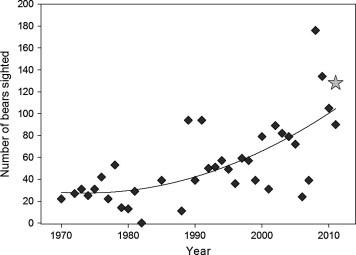
From the paper: “Figure 4. Polar bear counts from annual coastal surveys conducted between August 15 and September 15 from 1970 to 2011 in Western Hudson Bay in the region extending from the Nelson River to the Manitoba–Ontario border (i.e., Area 2; Stirling et al., 2004, Manitoba Conservation unpublished data). The number of bears observed during this survey, including those sighted along the coast and on small islands during the coastal contour transects, is denoted by a gray star.” [my bold]
“Our 2011 aerial survey results are consistent with a 2004 estimate of abundance based on MR [mark-recapture](935; 95% CI: 794–1076; Regehr et al., 2007). However, previous analyses based on vital rates estimated from capture-based studies suggested that abundance would continue to decline beyond 2004 (Regehr et al., 2007 and Obbard et al., 2010). Thus, we expected that our abundance estimate would be substantially less than the 2004 estimate.
…
Equal probability of detection is a key assumption of capture-based methods. Unmodeled heterogeneity in capture probabilities produces a negatively biased abundance estimate and may impact survival estimates (Pollock et al., 1990). Thus, obtaining a random sample of individuals that represents the entire population of interest (or completely modeling unequal capture probabilities to eliminate capture heterogeneity) is necessary to generate reliable results.
In WH, sampling effort for MR historically concentrated around Churchill and in Wapusk National Park (i.e., the high density stratum, Fig. 1; e.g., Regehr et al., 2007), with limited and less frequent sampling elsewhere, such as southeastern WH (e.g., Area 2, Fig. 3; Lunn et al., 1997). Despite this geographically limited sampling, MR analyses have been considered to reflect abundance and trends for the entire WH population (Regehr et al., 2007 and Obbard et al., 2010), generally under the assumption that adequate ‘mixing’ ensures random sampling.
However, several lines of evidence suggest that this sampling strategy may have resulted in biased parameter estimates. Multiple studies have reported that polar bears in WH show a high degree of geographic fidelity within and between ice-free periods (Derocher and Stirling, 1990, Stirling et al., 2004 and Parks et al., 2006). Such site fidelity suggests that sampling a limited portion of WH may yield an estimate that includes only those bears that used the sampled area, not the entire population.
Additionally, the results of the aerial survey demonstrate that a significant proportion of bears are found outside the core MR study area in late summer, when most capture work historically has occurred (e.g., Regehr et al., 2007). Very low densities of polar bears in the Nunavut portion of WH during the early ice-free season suggest that any bias arising from limited sampling in this region is likely minimal. Conversely, high densities of bears along the coast in southeastern WH represent a large and seemingly increasing proportion of the population (Fig. 4); failure to adequately sample this region could negatively bias abundance estimates and obscure population trends.
…
The aerial survey represents the first systematic and geographically comprehensive survey of polar bears in WH. Thus, the results better represent the entire population than MR estimates based on sampling within a core study site. As such, WH appears to have more polar bears than previously thought. Our estimate, however, does not necessarily negate the declining trends in abundance, survival, reproductive output, and body condition reported from WH (Stirling et al., 1999 and Regehr et al., 2007). Because the aerial survey reflects a larger effective area (the entirety of WH) than the MR studies (a smaller proportion of the population), results from the 2 methods cannot be directly compared to assess population trend. It would be erroneous to suggest that our estimate indicates that the population is not declining. Indeed, the aerial survey indicated that reproductive performance in WH during 2011 was relatively poor, consistent with findings of capture-based studies (Regehr et al., 2007). Mean litter sizes and the proportions of cubs-of-the-year and yearlings recorded in WH were low relative to adjacent populations (Table 2), suggesting that WH is currently less productive than other populations in the Hudson Bay complex and nearby regions (Peacock et al., 2010). Nevertheless, the apparent increased use of southeastern WH, coupled with the lack of sampling there, could result in an inaccurate assessment of trends in abundance, survival, and other measures of population status. The differences in sampling frames and associated uncertainties must be clearly communicated to decision-makers, and southeastern WH should be fully integrated in future studies to evaluate demography and status of polar bears across the population.” [my bold]
Note that failure of mark-recapture studies in Western Hudson Bay to meet the key assumption of “equal probability of detection” was a similar issue that invalidated the results of the 2006 survey of Southern Beaufort bears (discussed in detail here and mentioned in the last status update by the IUCN Polar Bear Specialist Group).
What is significant about this finding is that the results of these two population studies (Western Hudson Bay and Southern Beaufort) formed a portion of the basis for the 2008 decision by the US Fish and Wildlife Service to declare polar bears ‘threatened with extinction” under the Endangered Species Act. These two studies constituted the evidence, such as it was at the time, that bears were already suffering harm from reduced summer ice coverage. The bulk of the decision, of course, rested on the assumption that this “harm” would continue or worsen, and spread to other subpopulations, according to computer-modeled predictions of future sea ice declines.
Research since 2006, however, has shown none of these harms have been realized, despite two very low sea ice minimums in late summer (2007 and 2012), as summarized here.
Finally, I should point out that the lack of population decline but reduced “reproductive performance” for Western Hudson Bay bears found by Stapleton and colleagues in 2011 was almost certainly the result of a single, especially early breakup of the sea ice the year before the survey was conducted.
See last week’s post on breakup dates for Western Hudson Bay, showing that breakup was as early in 2010 as it was in 1999 (~ 17 June) – almost certainly accounting for the reduced “reproductive performance” the next year (i.e., smaller litter sizes and lower proportions of cubs than in Southern Hudson Bay and Foxe Basin). A fewer number of females would have become pregnant in 2010 and some would have lost cubs born that spring — due to less-than-optimal fat reserves — resulting in fewer cubs counted the following year.
However, breakup dates have been average or later since then (2012-2104), and the bears have almost certainly recovered.
Since the winter of 2012, most females should have been able to put on adequate fat reserves (through their spring/early summer feeding) to sustain their pregnancies and successfully raise their cubs. In other words, it is most likely that the reduced reproductive performance documented in 2011 was a momentary “blip” for the Western Hudson Bay population.
Any suggestion that cub production in Western Hudson Bay continues to be reduced relative to Southern Hudson Bay and Foxe Basin needs to be substantiated by a survey conducted after a year with a later-than-average breakup date.


You must be logged in to post a comment.