
There is a rather large patch of open water in the northwest sector but what’s also unusual about breakup this year is the virtual lack of open water in eastern Hudson Bay – that almost never happens (compare to 2013 here). In addition, there’s still very little open water in Hudson Strait, which connects Hudson Bay to Davis Strait in the east – that’s also unusual.
Figure 1. Sea ice extent over Hudson Bay and Hudson Strait at 26 May 2015. Canadian Ice Service. Click to enlarge.
The question is: does the somewhat unusual pattern of ice cover at this date – which developed rapidly over the last few weeks – suggest we can predict whether polar bears will have a shorter-than-average hunting season?
To answer that, you have to look at maps generated by the same source over several years. The result, in my opinion, is inconclusive – while so far, this year looks a bit more like 2009 (which was a very late sea ice breakup year) than it does 2011 (which was an early breakup year), it’s really too early to tell.
I suggest we simply won’t know for another month or so which pattern will prevail. However, that hasn’t stopped IUCN Polar Bear Specialist Group member Andrew Derocher (via Twitter, e.g., here and here, among many others) from suggesting that this year’s pattern is likely a portend of doom for Hudson Bay polar bears. See what you think.
One factor that’s important, in my opinion, is that despite that rather large patch of open water this year, the concentration of the ice remaining over Hudson Bay at 26 May 2015 is still at least 80-100% (see Figs. 2 below), while the ice concentration in Hudson Strait is at 60%.
Polar bears prefer 50% concentration or higher, but can utilize 15-50% ice cover when necessary – which means that hunting conditions are still excellent for polar bears over most of Hudson Bay and Hudson Strait at this time. In addition, the ice that remains is 1-2 m thick (see it here), which is plenty thick enough for polar bears.
Figure 2. Sea ice concentration at 26 May 2015, courtesy Naval Research Laboratory. Click to enlarge.
Comparing this year’s patterns to previous years
The only organization that produces daily sea ice maps with enough detail for comparing melt patterns between years is NSIDC, via their MAISE regional products. These maps only go back to 2006, but it’s really all we’ve got (Hudson Bay is “r10”; maps archived by Julian Day, pdf here).
Current maps have a one-day lag, so the most recent map found today (26 May) is 25 May (day 145, see here). NSIDC uses a cutoff of 15% ice coverage for their maps – others, like Cryosphere Today, use 30%.
Keep in mind, however, that the accuracy of maps generated from satellite images during the melt season is notoriously low: algorithms devised to interpret the images often call melt-water ponds that develop on top of ice “open-water” when open water is not, in fact, present.
Fig. 3 (below) shows that in 2011, an extensive wide shore lead developed along eastern Hudson Bay that extended into James Bay – we are seeing none of that open water in the eastern part of the bay this year (see also Fig.1). In addition, despite the large patch of open water in NW Hudson Bay this year, there is also very little open water in Hudson Strait – much less than there was in 2011, which was an early breakup year.
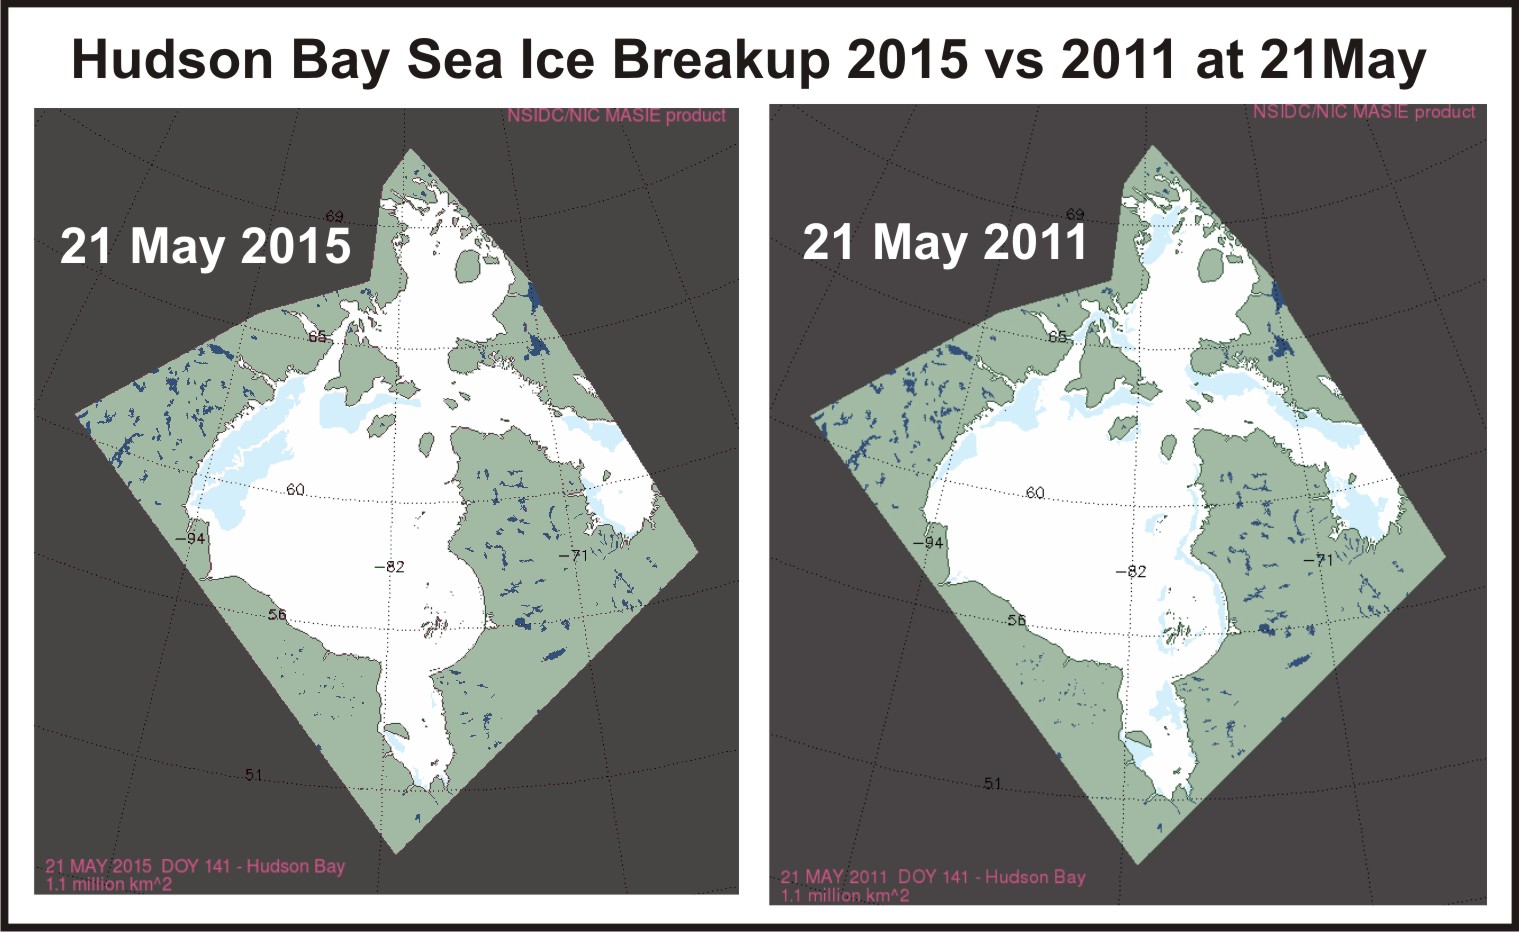
Figure 3. From NSIDC MAISE, 2011 (right) had almost exactly the same amount of ice cover at 21 May as did 2015 (left), according to CIS chart, Fig. 5. (below). However, the ice was distributed differently. Click to enlarge.
Have a look at Figure 4 below: there were significant amounts of open water in northwestern Hudson Bay at 21 May in 2015, 2009, 2011, and 2010. There is indeed more open water in this region this year (2015) than there was in 2009 (which had the same Western Hudson Bay breakup date as 1992, the latest since 1979), about half as much as in 2011 (a slightly-earlier-than-average breakup year), much less than there was in 2010 (the earliest breakup date since 1999) and less than 2006, which had a relatively early breakup date.
However, there is more ice this year in the eastern portion of the bay, and in Hudson Strait, than there was in those previous years.
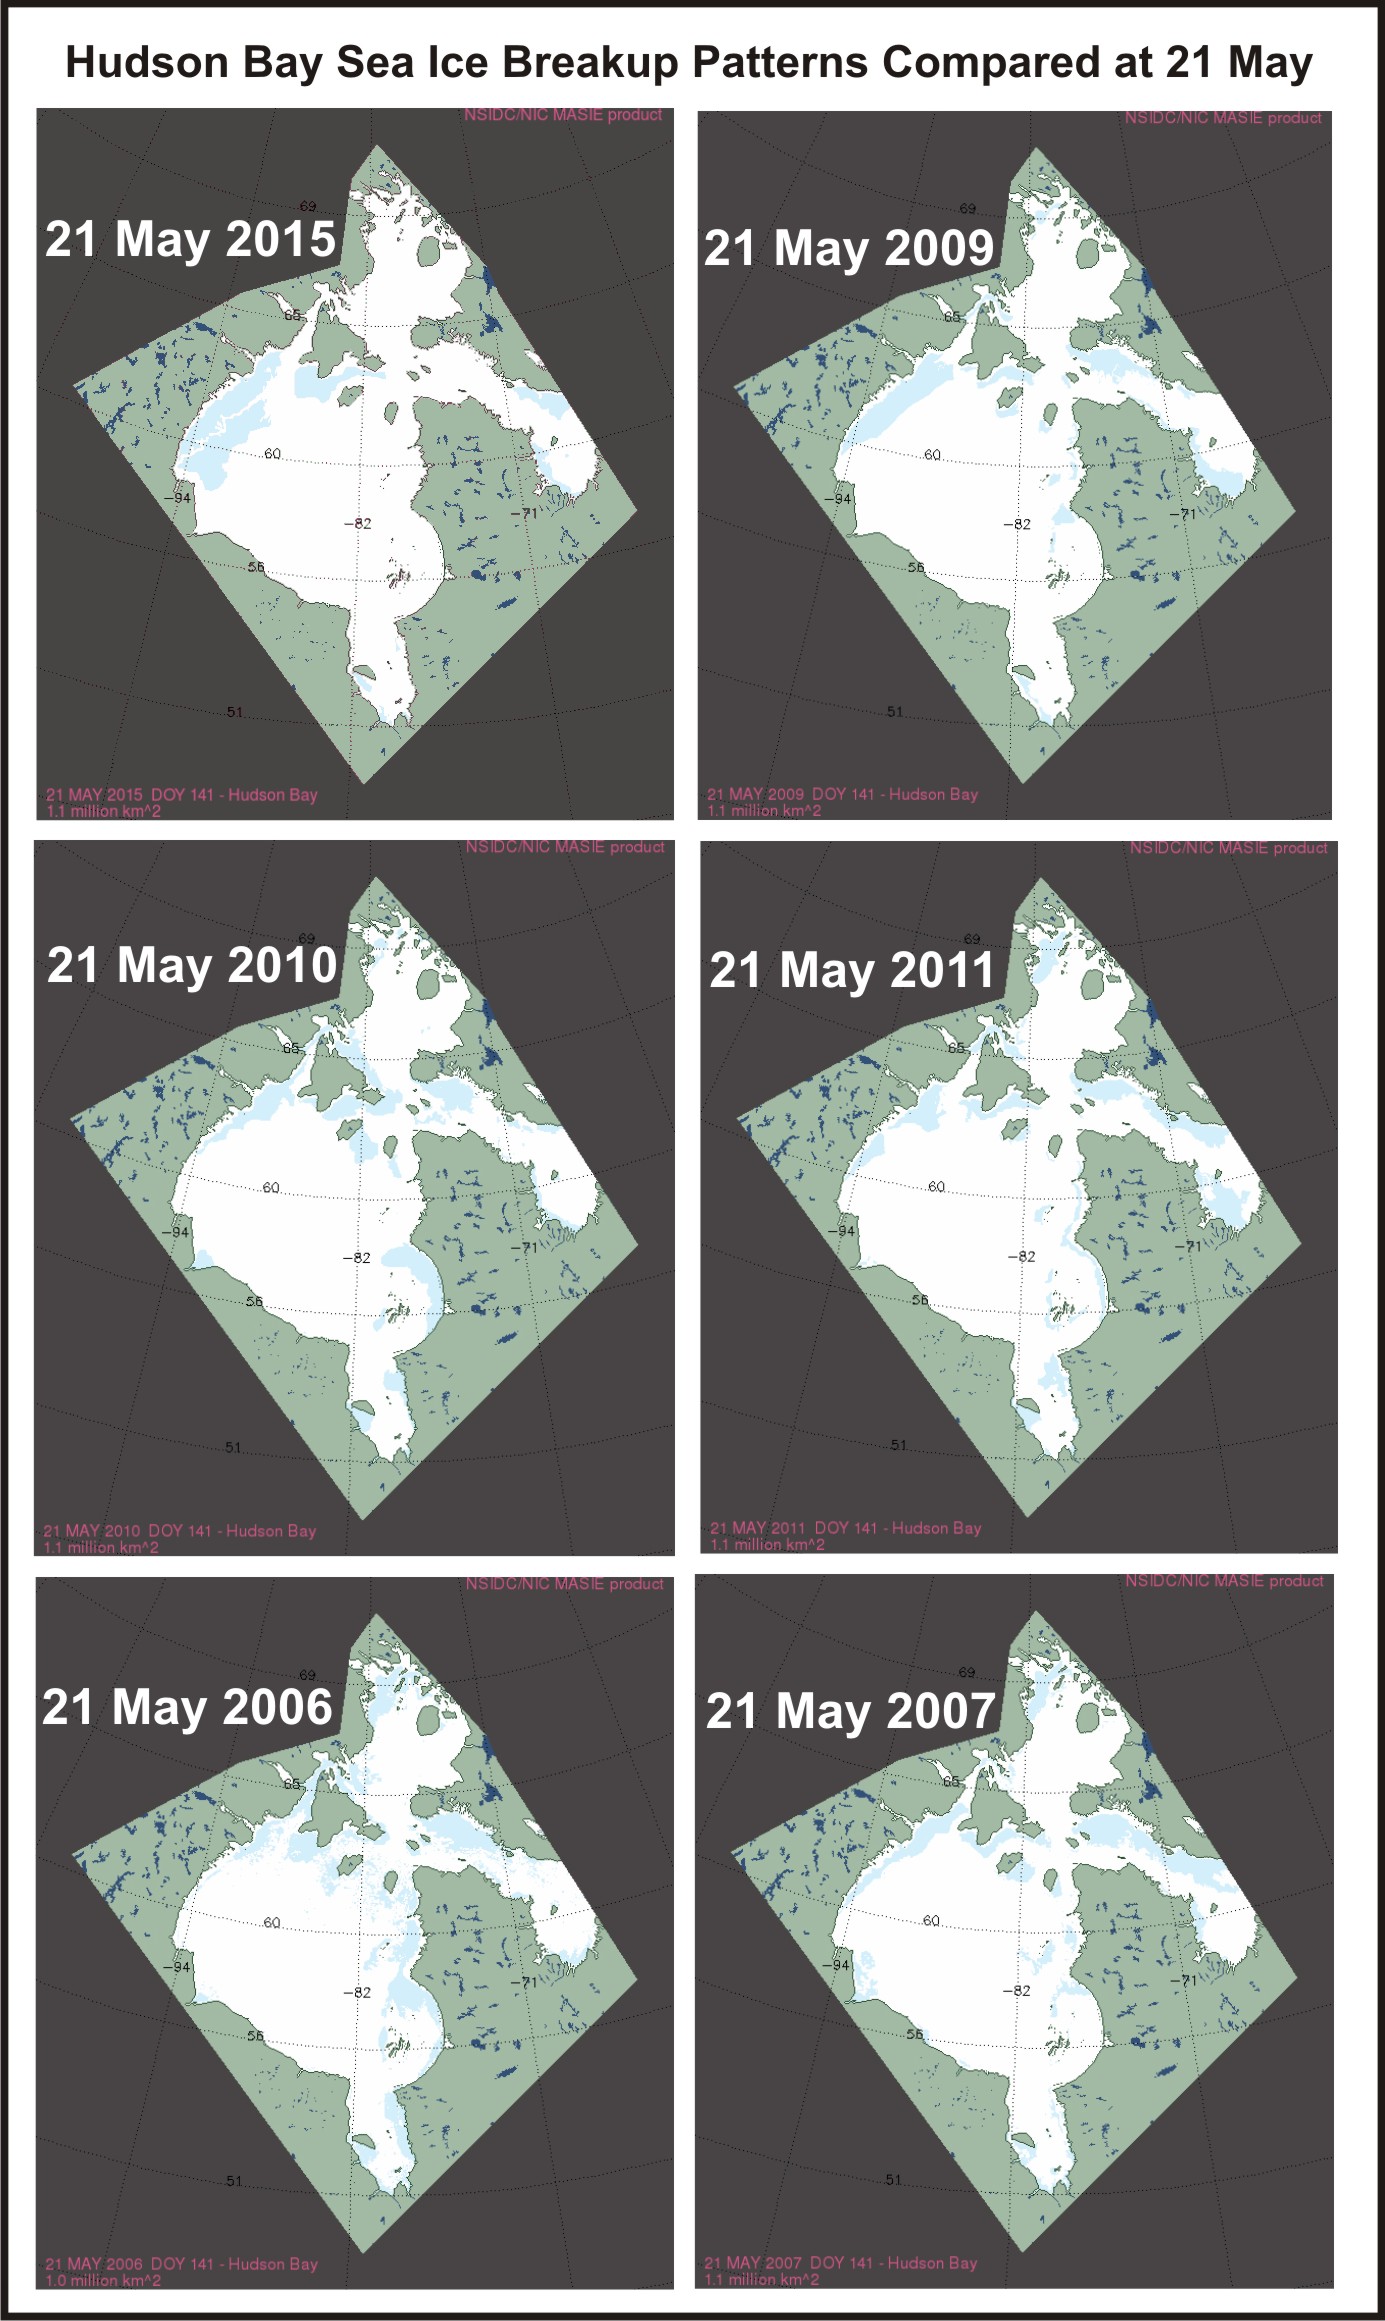
Figure 4. Comparing 2015 at 21 May (upper left) to 2009, 2010, 2011, 2006, and 2007. Original maps found here. Click to enlarge.
The graph below (Fig. 5) shows that early breakup year 2010 had much less overall ice coverage for the week of 21st May than did 2015, while slightly-earlier-than-average breakup year 2011 and later-than-average breakup year 2012 had about the same amount of coverage. Much later-than-average breakup year 2009, in contrast, had much more ice at this date than 2015, as did about-average breakup years 2013 and 2014.
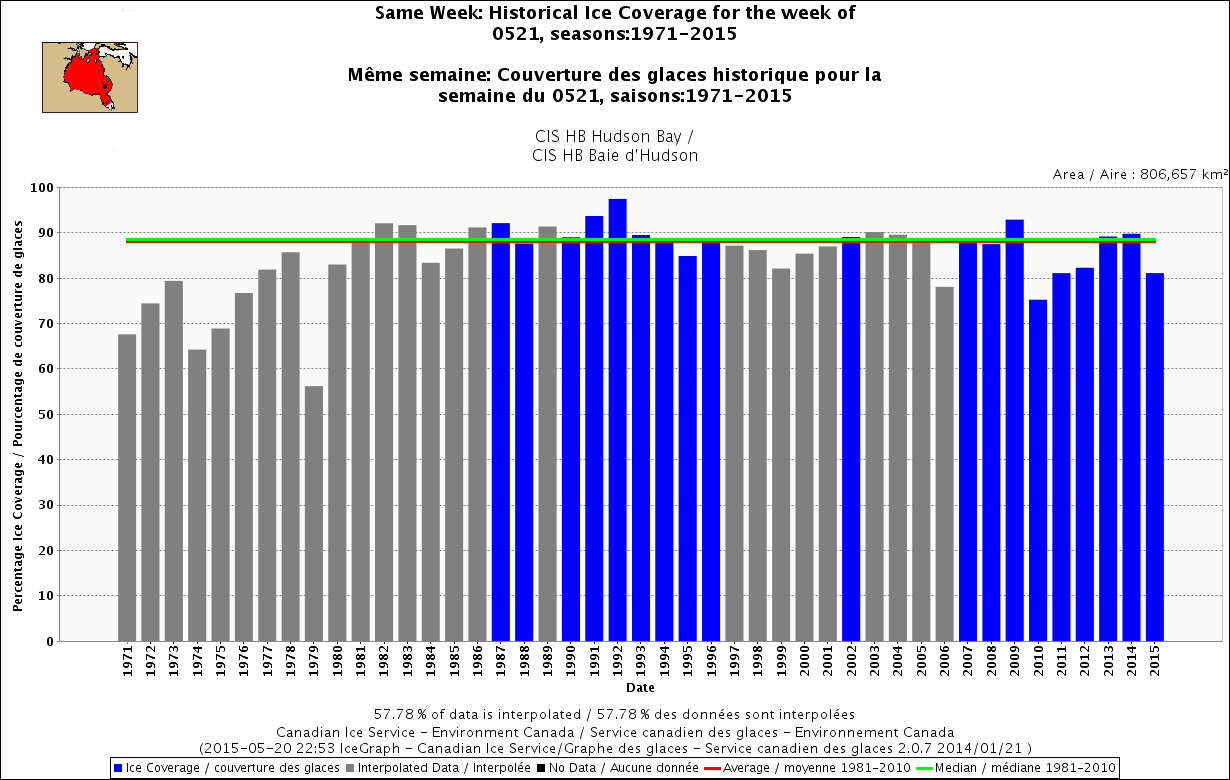
Figure 5. Sea ice cover over Hudson Bay for the week of 21 May, 1971-2015. CIS. Click to enlarge.
If we include Hudson Strait and southern Davis Strait in our analysis of overall ice cover (Fig. 6), this year is more like 2013 – which had an average Western Hudson Bay breakup date.
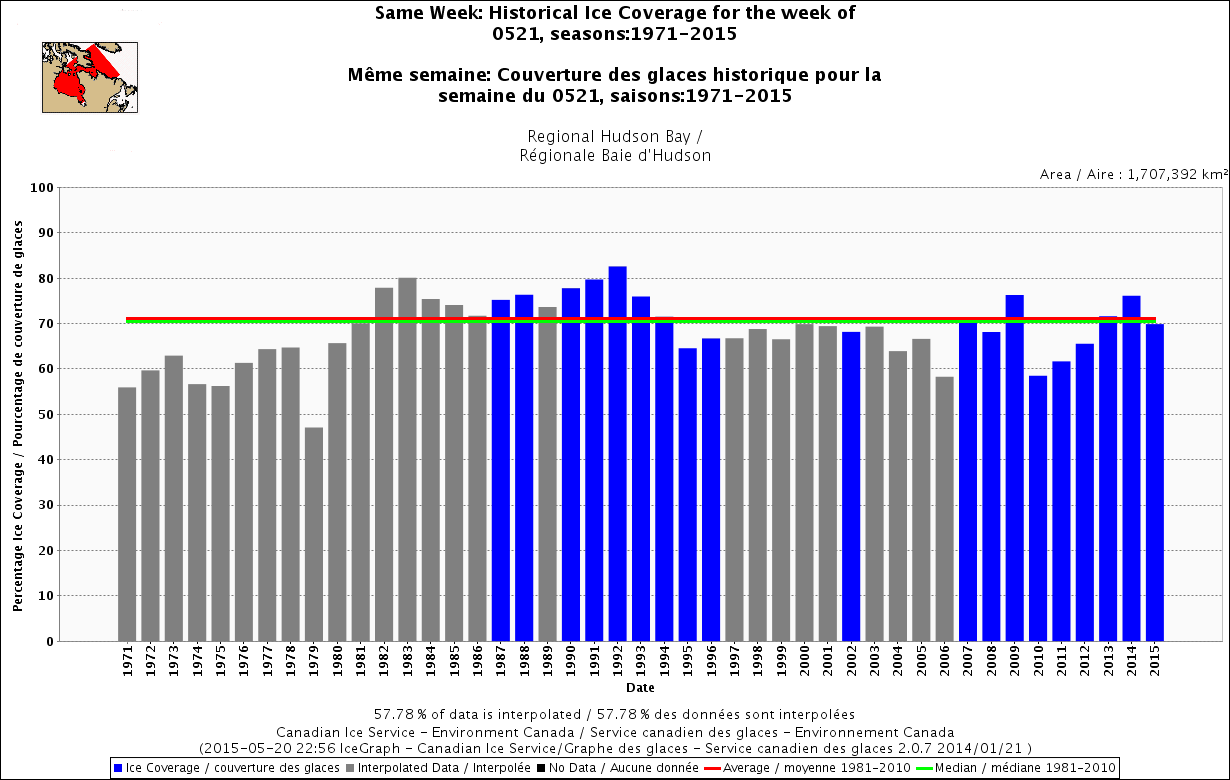
Figure 6. Sea ice cover over Hudson Bay, Hudson Strait and southern Davis Strait for the week of 21 May, 1971-2015. CIS. Click to enlarge.
Ultimately, what counts as far as polar bears are concerned is how long they have been able to hunt from late March to June and how successful they have been during that period (snow cover and ice thickness also matter).
See Fig. 7 below for a comparison of how much sea ice remained in Hudson Bay at July 1 (the average breakup date for Western Hudson Bay since 1991) for 2014, 2013, 2006, and 2009. Breakup patterns of sea ice over Hudson Bay are clearly highly variable from year to year at the start of the Arctic summer and the weeks leading to it, as are relative amounts of ice over Hudson Strait.
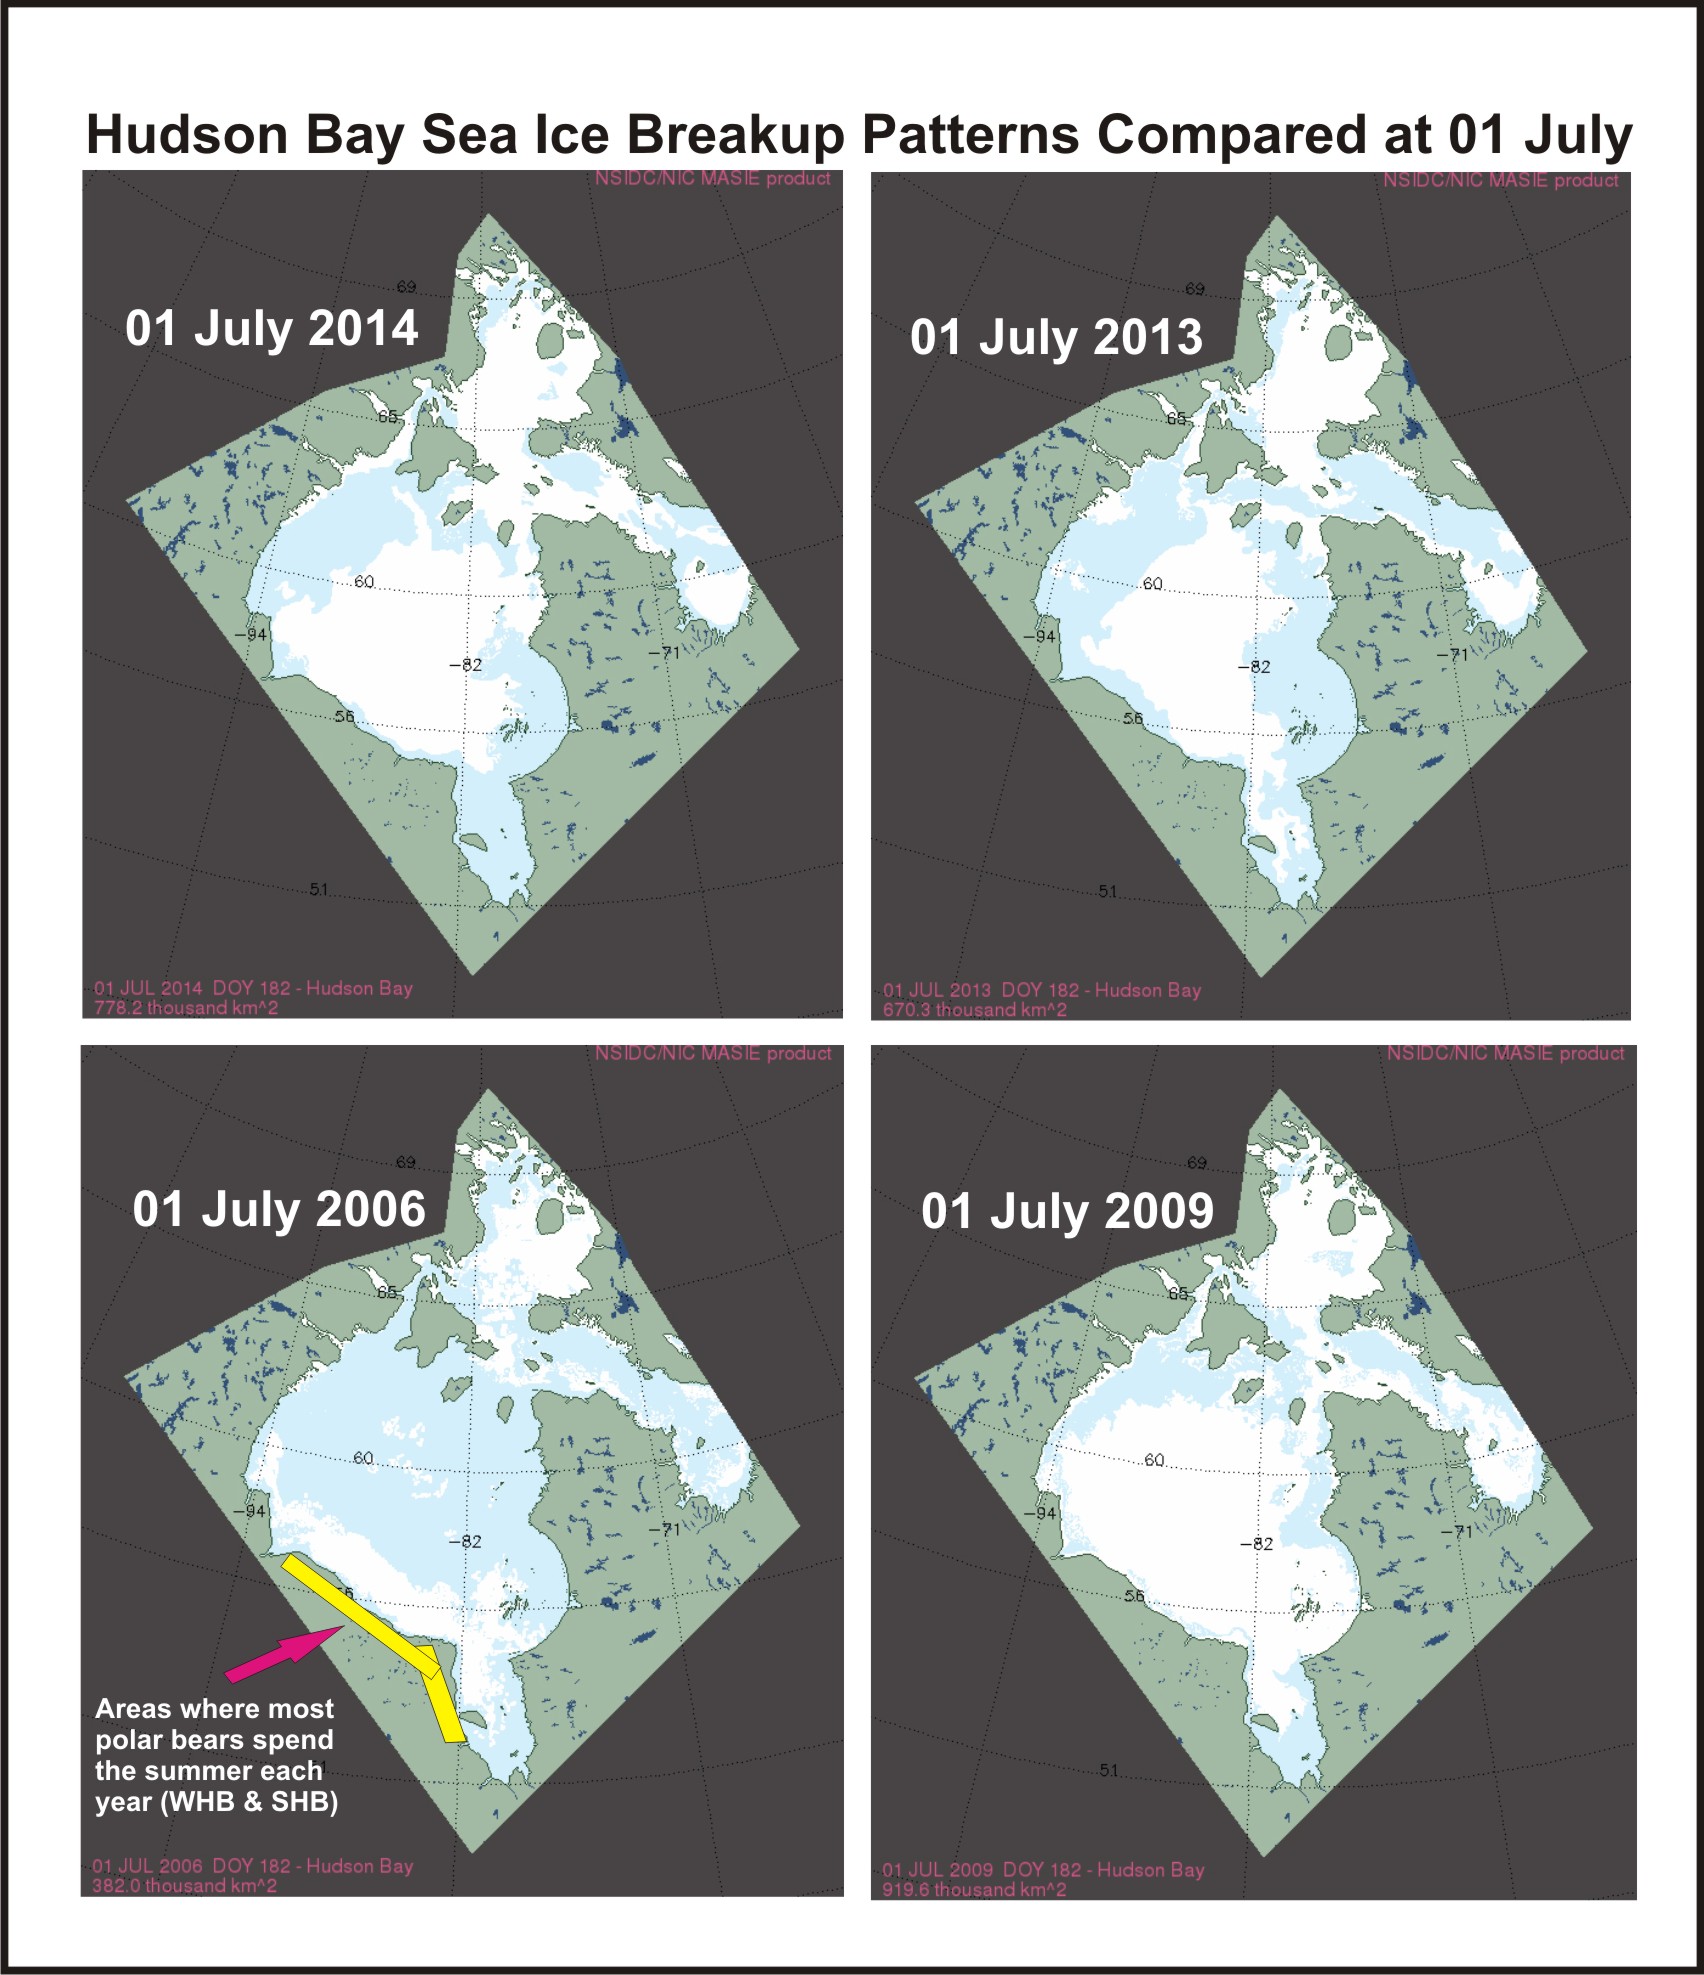
Figure 7. Hudson Bay sea ice patterns compared at 01 July (Region 10, day 182), which has been the average date of breakup since 1991: 2014, 2013, 2006, 2009. NSIDC MAISE products archive. Note that 2009 had one of the latest breakup dates on record (30 July), while 2006 was relatively early (mid-June). Click to enlarge.
Conclusion
Despite Andrew Derocher’s pessimism, there is still a lot of thick, concentrated sea ice over Hudson Bay and Hudson Strait – which means lots of polar bear hunting habitat still available. That won’t necessarily prevent a few bears from leaving the ice before it’s really necessary but that can happen any year.
Comparing sea ice breakup patterns over the last 10 years at this time in the melt season suggests to me that this year is more likely to be a relatively late breakup year rather than an early one but it could go either way.
Since we won’t know for sure for another month or so, incessantly gloomy speculation is scientifically inappropriate.
[See my earlier discussion on melt patterns in the Beaufort Sea here, and a discussion of polynya development across Canada and in Hudson Bay particularly here]


You must be logged in to post a comment.