Tag Archives: Queen Elizabeth Islands

Sea ice silly season: Wadhams spouts fake facts about polar bears of northern Greenland

As the seasonal minimum for Arctic sea ice approaches, the media get carried away by hyperbole. Tha’t been true since 2007. This year, other outlets will need to work hard to beat yesterday’s bit of nonsense from The Independent trying to out-do The Guardian: it not only includes false polar bear facts (from sea ice researcher Peter Wadhams) but leads with last year’s controversial SeaLegacy video of an emaciated polar bear. Sea ice silly season has truly begun.

East Greenland Scorsby Sound March 2011 on Kap Tobin_Rune Dietz_press photo

Wadhams (described as “one of the UK’s leading sea ice scientists” although not a particularly respected one) was interviewed about the small area of open water that opened up over the last few days in northern Greenland (see NSIDC photo below), driven by offshore winds (not melt). This region is the eastern-most part of the area that is considered the “last holdout” for Arctic sea ice: an immense band of very thick (4-20m) multiyear ice that stretches across the Arctic Ocean shores of the Canadian Arctic Archipelago.

The open water is expected to last a few days at most but Wadhams was absolutely breathless with dire warnings of what this might mean for the future of polar bear in the region (about which he knows nothing), rhetoric ramped up even further by the news outlet with quotes from co-director of the Grantham Institute (London), Martin Siegert, and predictions on how low the sea ice minimum might be.

Greenland north open water_13 Aug 2018 NASA_NSIDC 15 Aug 2018 report

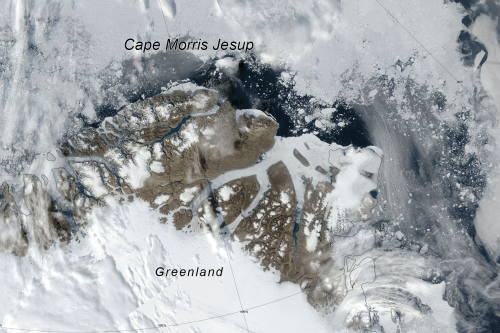
Cape Morris Jesup on 13 August 2018. W. Meier, NSIDC/NASA.

I think this is a truly spectacular example of the ignorance of scientists speaking outside their area of expertise used to mislead the public but decide for yourself.

Continue reading

Graphing polar bear population estimates over time

I’ve already commented on the 2013 update of polar bear population status released by the IUCN Polar Bear Specialist Group (PBSG).

However, I thought it might be interesting to graph the changes in global population estimates over time (from 1981-2013) — not just the actual estimates from PBSG status tables (with their min/max error ranges) but those totals plus the so-called “inaccurate” estimates that the PBSG have dropped from their accounts in recent (2005-2013) assessments: Chukchi Sea, East Greenland, Queen Elizabeth Islands (now known as the “Arctic Basin”), and Laptev Sea.

In 2001, those “inaccurate” estimates contributed 5,000-5,400 bears to the global total, but now they’re gone — no bears from those regions contribute to the official totals listed on recent PBSG status tables.

Adding those dropped estimates back into the global totals makes it possible to generate a graph in which the global estimates are truly comparable over time.

To see how the dropped estimates influenced the perception of population change over time, I’ve also graphed the estimates given by the PBSG in their status tables. I’ve combined the two into one image (Fig. 1, click to enlarge) to make comparison easy.

UPDATE 5 December 2014: Links to more recent posts relevant to this issue added below. The most recent numbers, added 31 May 2015, are here.

UPDATE 26 March 2019: See “Latest global polar bear abundance ‘best guess’ estimate is 39,000 (26,000-58,000)
Continue reading

Global population of polar bears has increased by 2,650-5,700 since 2001

The official population estimates generated by the IUCN Polar Bear Specialist Group (PBSG) give the impression that the global total of polar bears has not changed appreciably since 2001:

2001 PBSG report                  21,500-25,000

2005 PBSG report                  20,000-25,000

2009 PBSG report                  20,000-25,000

2013 PBSG website                20,000-25,000

2015 IUCN Red List              22,000-31,000 [see latest update note]

However, some accounting changes were done between 2001 and 2009 (the latest report available) that mean a net increase in numbers had to have taken place (see summary map below and previous post here. Note this is a different issue than the misleading PBSG website graphic discussed here).

And while it is true that population “estimates” are just that — rather broad estimates rather than precise counts — it is also true that nowhere do the PBSG explain how these dropped figures and other adjustments were accounted for in the estimated totals. 

The simple details of these changes are laid out below, in as few words as I could manage, to help you understand how this was done and the magnitude of the effect. It’s a short read — see what you think.

UPDATE 15 May 2016: In late November 2015, the IUCN Red List of Threatened Species published a new assessment for polar bears that estimated the global population at 22,000-31,000 and stated the trend was ‘Unknown’. See details here and here – which includes links to the official report and the press release. Sorry for the delay in updating this post.

UPDATE 31 May 2015: See the latest population numbers here.

UPDATE 5 December 2014: Links to more recent posts relevant to this issue added below. [including this one: Status of Canadian polar bear populations has been changed – more good news October 28, 2014

UPDATE February 14, 2014a new status table has been released, see new post here 

UPDATE February 18, 2014 — see graphs of the 1981-2013 estimates here.

Polar bear subpopulations as defined by the PBSG: Top, in the 2001 report; Bottom, 2009 report. Map courtesy PBSG, with a few labels added and the subpopulations identified where “accounting” changes or adjustments to estimates took place.SB, Southern Beaufort; NB, Northern Beaufort; VM, Viscount Melville; MC, M’Clintock Channel; LS, Lancaster Sound; GB, Gulf of Boothia; NW, Norwegian Bay; KB, Kane Basin; WH, Western Hudson Bay. Click to enlarge.

Polar bear subpopulations as defined by the PBSG: Top, in the 2001 report; Bottom, 2009 report. Map courtesy PBSG, with a few labels added and the subpopulations identified where “accounting” changes or adjustments to estimates took place.
SB, Southern Beaufort; NB, Northern Beaufort; VM, Viscount Melville; MC, M’Clintock Channel; LS, Lancaster Sound; GB, Gulf of Boothia; NW, Norwegian Bay; KB, Kane Basin; WH, Western Hudson Bay. Click to enlarge.

Continue reading