Tag Archives: sea ice minimum

Now at least 10 years with sea ice at 2050-like levels yet polar bears are still abundant

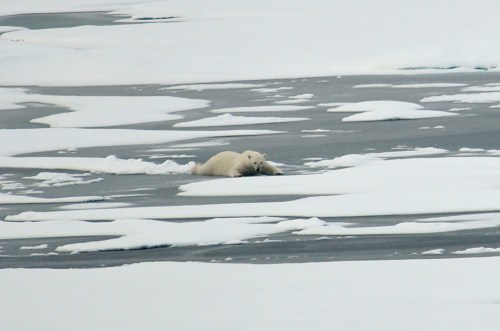
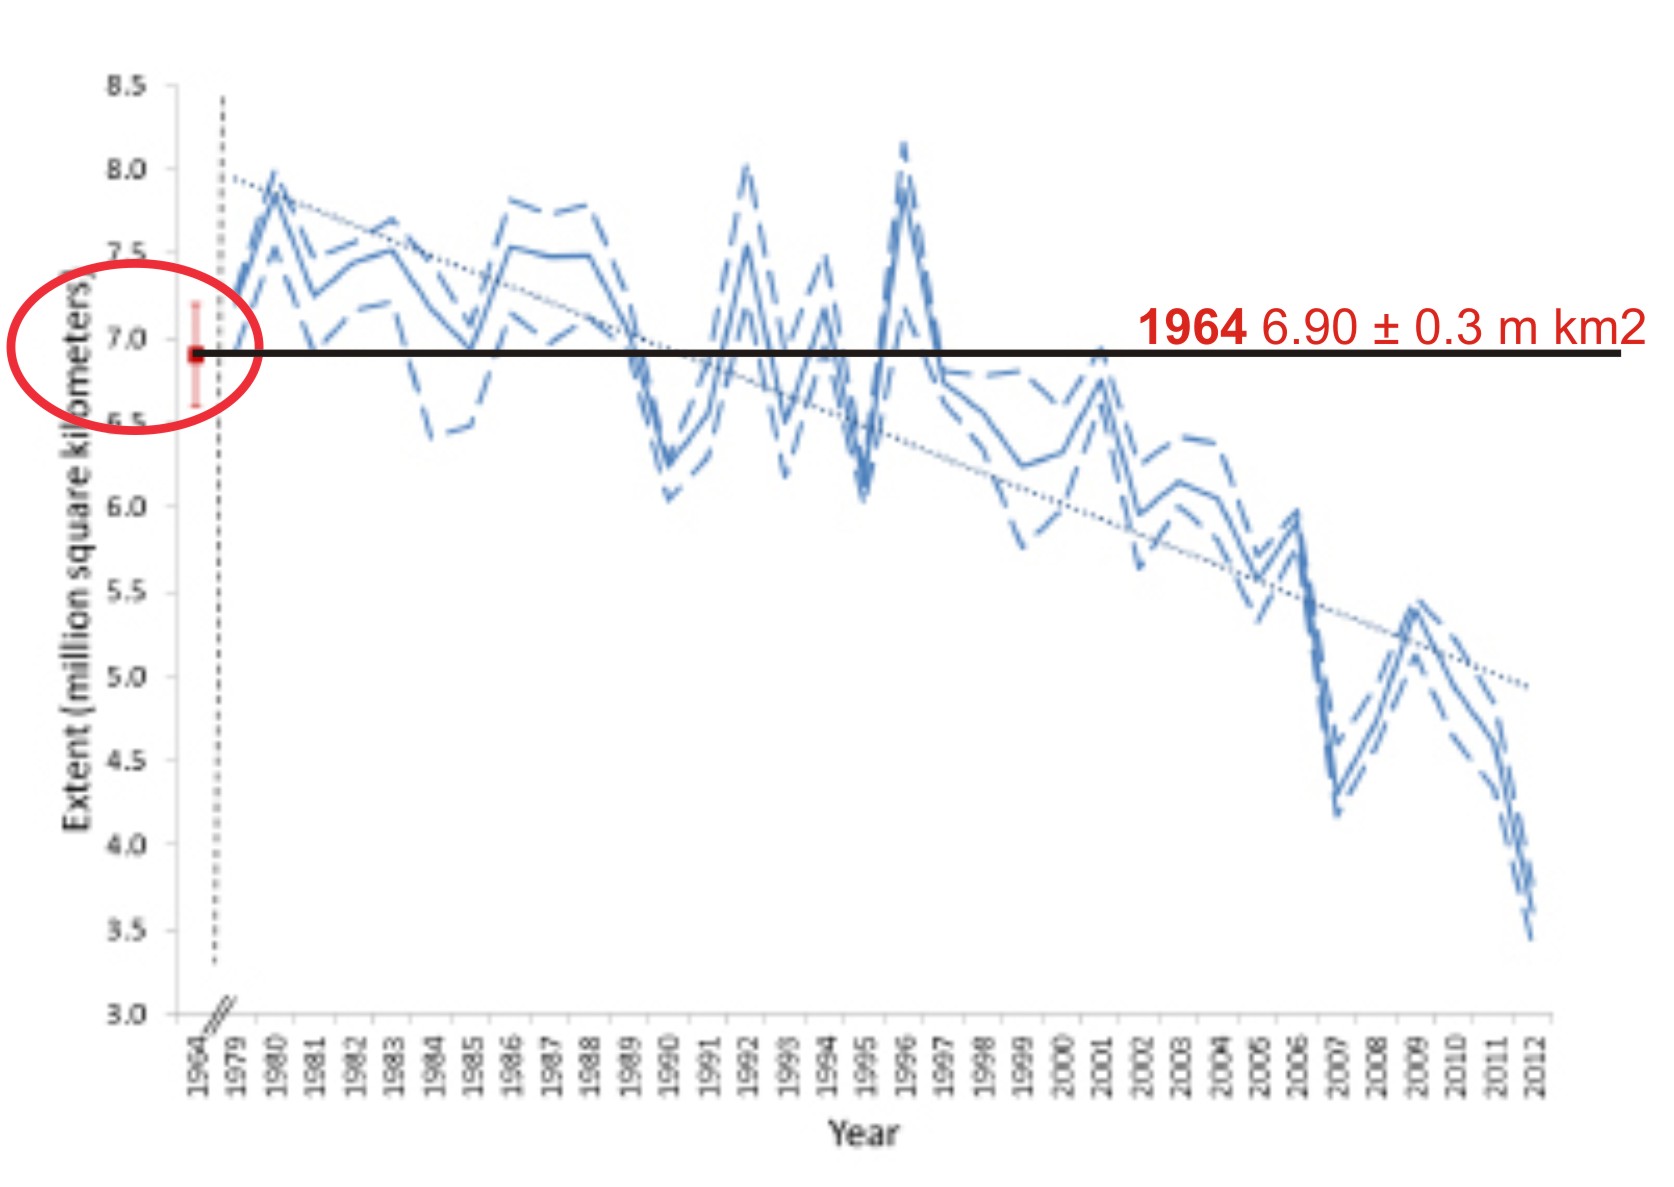
We’ve hit the seasonal Arctic sea ice minimum for this year, called this morning by US NSIDC for 19th and 23rd of Septmeber: 4.59 mkm2, the same extent as 2008 and 2010. This is not a “ho-hum” year for polar bears: it means that since 2007, they have triumphed through 10 or 11 years1 with summer ice coverage below 5.0 mkm2 —  levels that in 2007 were expected to cause catastrophic declines in numbers.

polar-bear-on-thin-ice_21-aug-2009_patrick-kelley-us-coast-guard.jpg

Summer sea ice below 5.0 mkm2 were not expected to occur until about 2050, according to 2005/2006 sea ice models and polar bear specialists at the US Geological Survey (USGS). Polar bear survival models predicted 2/3 of the world’s polar bears would disappear when ice levels reached this threshold for 8 out of 10 years (Amstrup et al. 2007, 2008; Hunter 2007) but polar bears have been more resilient than expected (Crockford 2017, 2018; Crockford and Geist 2018). In fact, in many areas (like the Chukchi Sea, Barents Sea and Foxe Basin) polar bears are thriving despite dramatic declines in summer sea ice coverage (Aars et al. 2017; ACSWG 2018; Peacock et al. 2013; Regehr et al. 2016; Stapleton et al. 2016).

The sea ice models used to support the addition of polar bears to the US Endangered Species List as ‘threatened’ with extinction suggested sea ice levels from 3-5 mkm2 would not occur unti mid-century, yet they dropped before the ink was dry on the 2007 USGS Reports (ACIA 2005; Hassol 2004; Holland et al. 2006; Solomon et al. 2007; Zhang and Walsh 2006).

The ice extent charts from the University of Bremen (below) show ice that’s 50% concentration or greater at the date of the seasonal minimum (19th September): what polar bear specialists define as preferred habitat (Amstrup et al. 2007).

arctic_amsr2_visual_2018_sept_19.png

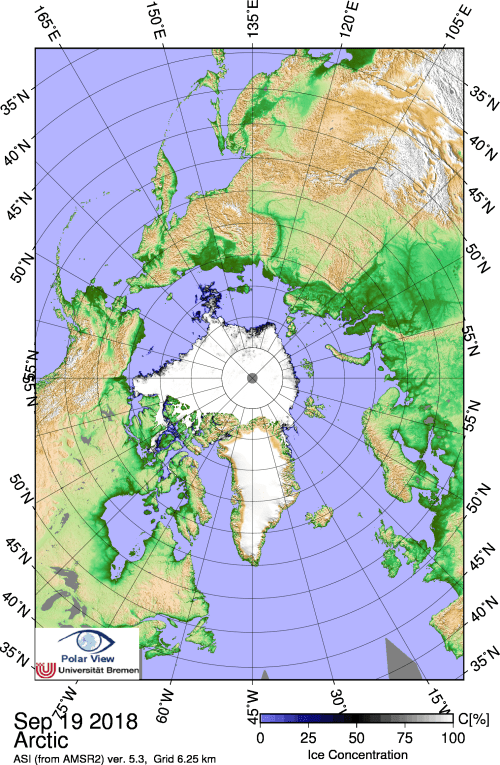
Compare the minimum shown above to the coverage predicted for 2050 and to coverage at the minimum in 2012 (the NSIDC image is here):

Continue reading

Polar bear habitat update: regional differences, melting vs. freezing

The freeze is on: from an annual low of ~5.1 m sq km at 15 September 2014, the sea ice that provides a hunting platform for polar bears is rapidly reforming.

Note that polar bear habitat world-wide is pretty well defined by the extent of sea ice in spring, with three notable exceptions. There are no polar bears (or fossil evidence of polar bears), in the Sea of Okhotsk, the Gulf of St. Lawrence, or the Baltic Sea.

Bears in some areas spend time on land in late summer/early fall but the amount of time varies widely.

Polar bear distribution and ice extent_PolarBearScience
Have a look at the maps below: the difference in regional coverage between the sea ice at 4 August and 16 October (73 days apart, both covering 7.3 mkm2) might surprise you.
Continue reading

Natural selection helps polar bears adapt to sea ice variability – which means some bears die

Evolution is not just for the long-term – natural selection also goes on over short time periods. In the case of polar bears, this adaptation is almost certainly critical for its long-term survival.

Hudson Bay female with cub_Wapusk_Thorsten Milse_Gov CA

Hudson Bay female with cub Wapusk National Park, Thorsten Milse, Government of Canada

Not all polar bears are identical — that is the reality that allows natural selection to operate.

I will argue that early breakup years in Western Hudson Bay weed out individual polar bears that do not have the physiological or behavioral characteristics necessary to be useful members of the population – and that this is a good thing for the entire population.

Continue reading

NSIDC says the sea ice minimum in 1964 was not different from 1979, 1981, or 2001

I just came across the National Snow and Ice Data Center (NSIDC) “monthly highlights” article for April 2013 (Glimpses of sea ice past), which turned out to be a rather more interesting story than it appeared at first glance.

The article chronicles the details of how NSIDC technicians pieced together photos taken by the Nimbus 1 satellite between August 28 and September 23, 1964 – of both the Arctic and the Antarctic – to create an estimate of sea ice extent at September 1964 for both regions. For the Arctic, this was the yearly minimum; for the Antarctic, the yearly maximum.

NSIDC scientist Walt Meier was part of this effort and he and colleagues Gallaher and Campbell recently published their findings in the journal The Cryosphere (Meier et al. 2013). For the Arctic estimate, they had to add in data from Alaskan and Russian sea ice charts because the 1964 satellite data was not complete. This means the ice extent figure they came up with is not a true ‘satellite only’ figure but a composite one.

One of the things they did in their analysis was to place the 1964 value on a graph of the more recent 1979-2012 data, which really helps put it into perspective (see Fig. 1 below).

Figure 1. This is Fig. 7 from the Meier et al. 2013 paper, to which I’ve added labels. Meier et al. call this a “time series of Arctic September sea ice extent.” The estimate for 1964 is the red dot on the far left (with its error bars), which I’ve circled (I also added the red label for 1964 and the black line). Note the Y-axis on the left goes to 3.0 million km2, not zero. The solid blue line is the monthly average for September from passive microwave data (1979-2012), and the blue dashed lines are a “three-day average of the high and low range of daily extents during the month.” The 1964 estimate of 6.90 ± 0.3 million km2 is just about identical to 1979, 1981, and 2001 and well within the average for 1979-2000. However, it’s significantly lower than the previous estimate of 8.28 million km2 for 1964 made by the UK Hadley Centre in 2003 (Meier et al. 2013:704).

Figure 1. This is Fig. 7 from the Meier et al. 2013 paper, to which I’ve added labels. Meier et al. call this a “time series of Arctic September sea ice extent.” The estimate for 1964 is the red dot on the far left (with its error bars), which I’ve circled (I also added the red label for 1964 and the black line). Note the Y-axis on the left goes to 3.0 million km2, not zero. The solid blue line is the monthly average for September from passive microwave data (1979-2012), and the blue dashed lines are a “three-day average of the high and low range of daily extents during the month.” The 1964 estimate of 6.90 ± 0.3 million km2 is just about identical to 1979, 1981, and 2001 and well within the average for 1979-2000. However, Meier and colleagues note it is significantly lower than the previous estimate of 8.28 million km2 for 1964, made by the UK Hadley Centre in 2003.

Continue reading

Polar bear spin reaches epic proportions at Bangkok CITES meeting

As I mentioned here in an update to my March 7th post, Damian Carrington at the Guardian Environment blog had this telling quote about the CITES deliberations that took place prior to the vote to ban polar bear trade (by uplisting its status from Appendix II to Appendix I):

As the debate raged, national delegates from other countries got confused by the strident but conflicting claims. “Where is the truth? Is it true that the polar bear is declining. Is it true that trade is increasing? We need to know,” said the Egyptian delegate.[my bold]

Indeed. Was there “truth” in the presentations heard by delegates? By that I mean, honest presentations of facts so that delegates could make up their own minds, or facts loaded with spin to sway the decision one way or another? I wasn’t there so I can’t say. But we can get some impression of what might have been said from two press releases statements issued after the vote failed by two parties that were actively promoting acceptance of the US-led proposal.[Update: Humane Society Press Release is here] Continue reading