
The annual summer sea ice minimum in the Arctic has been reached and while the precise extent has not yet been officially determined, it’s clear this will be the ‘second lowest’ minimum (after 2012) since 1979. However, as there is no evidence that polar bears were harmed by the 2012 ‘lowest’ summer sea ice this year’s ‘second-lowest’ is unlikely to have any negative effect.
This is not surprising since even 2nd lowest leaves summer ice coverage in the Arctic at the level sea ice experts wrongly predicted in 2005 wouldn’t be seen until 2050 (ACIA 2005; Amstrup et al. 2007; Wang and Overland 2012) and this is the same amount of summer sea ice that polar bear experts incorrectly predicted would cause 2/3 of all polar bears to disappear. My book explains how it all went wrong: The Polar Bear Catastrophe That Never Happened.
In this summary of how polar bears have been doing since the the lowest sea ice minimum in 2012, I show that contrary to all predictions, polar bears have been thriving despite reduced summer ice in the Barents, Chukchi and Southern Beaufort Seas, and because of unexpectedly short ice-free seasons in Hudson Bay and less multiyear ice in the Canadian Arctic Archipelago.
UPDATE 21 September (10:20 PT): NSIDC has just announced the Arctic sea ice extent minimum (preliminary) for 2020 at 3.74 mkm2 reached on 15 September. See full report here.
Polar bear specialist Andrew Derocher claimed a couple weeks ago that low summer sea ice – such as occurred in 2012 – harmed polar bear ‘energetics’:
This statement implies that overall Arctic summer ice at 2012 had a direct detrimental effect on health and survival because bears were not getting enough to eat – and by extension, spelled imminent disaster for the species. In fact, no evidence exists that the especially low summer sea ice levels in 2012 negatively impacted polar bears – or surely, Derocher would have provided it. On the contrary, what evidence does exist (from the Southern Beaufort, the Canadian Archipelago, and the Barents and Chukchi Seas), shows that polar bears in many areas have done better with less summer ice since 2007 or have had no negative effects. Other examples discussed here.
Southern Beaufort Sea
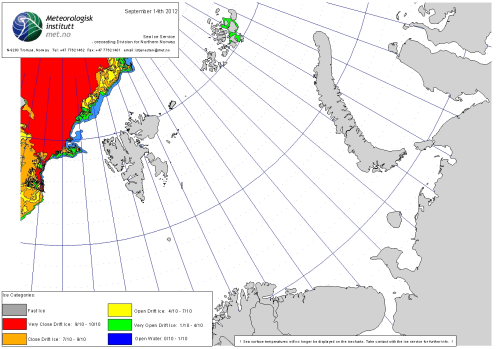
If low summer sea ice was going to decimate the Southern Beaufort subpopulation – as polar bear expert Steven Amstrup keeps insisting it will do – it should have done so in 2012. In 2012 the Arctic pack ice retracted a huge distance north of the coast of Alaska (see ice chart below for 13 Sept).
NISDC Masie ice chart at 13 September 2012.
But if there was a negative impact of low summer sea ice in 2012 on Southern Beaufort bear, it wasn’t evident by 2013, when researchers were doing field research in the area (Rode et al 2013, 2014, 2018) – in other words, there were no public alarms raised by biologists that polar bears were starving or that they were seeing much reduced numbers of cubs.
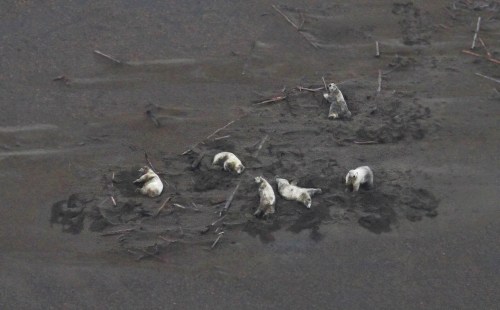
Any harmful effects were similarly not evident by July 2019, when more bears since 2012 (when a US Fish and Wildlife Service fall survey found numbers were higher than they had been in a decade, see USFWS 2013:17), were seen onshore – all fat and healthy – during a fall survey of the Alaskan coast (below).
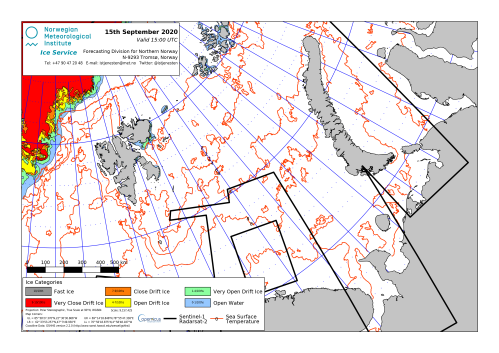
This year (see chart below), there is a lot more multiyear ice off the north coast of Alaska that has survived this year’s melt than there was in 2012, which means when freeze-up comes the ice will move sooner back against the shore (which didn’t happen until the end of October in 2012).
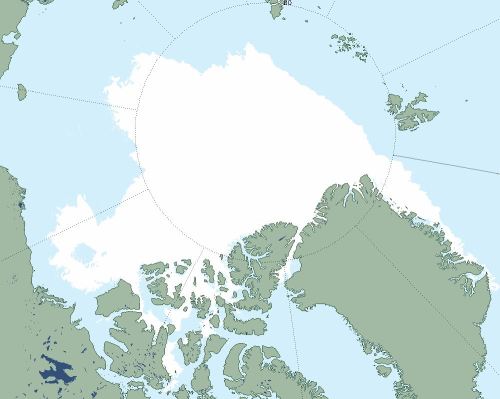
NSIDC Masie ice chart at 14 September 2020.
Barents Sea/Svalbard
The Barents Sea is considered by polar bear experts to be at high risk of population decline due to loss of summer sea ice (Amstrup et al. 2007). As of 2015, the area had lost the highest percentage of summer sea ice since 1979 of all polar bear regions (Regehr et al. 2016). Despite this massive decline in summer ice, Barents Sea polar bear numbers have not declined at all since 2004: rather, the Svalbard area population has seen a documented but ‘statistically insignificant’ increase of 42% that almost certainly can be extrapolated to the entire Barents Sea region (Aars 2018; Aars et al. 2017; Crockford 2019) – although the IUCN Polar Bear Specialist Group will only concede the population is ‘likely stable‘.
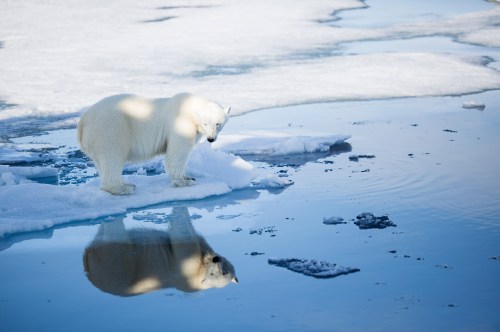
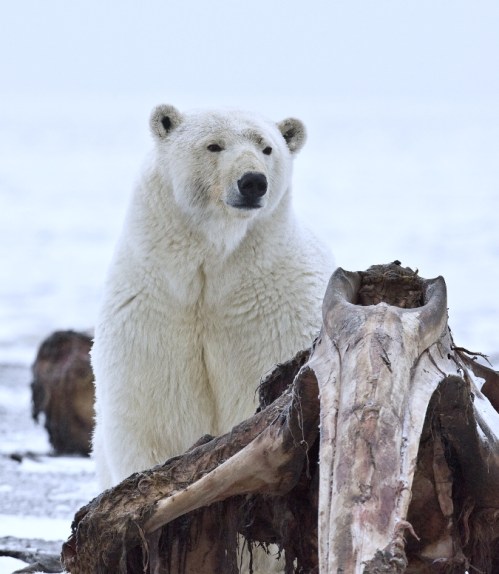
Moreover, the body condition of females has increased significantly (that’s statistically significant) since 2004 while the condition of males has been stable (Lippold et al. 2019) – bears captured during the August 2015 population count were in excellent condition (above).
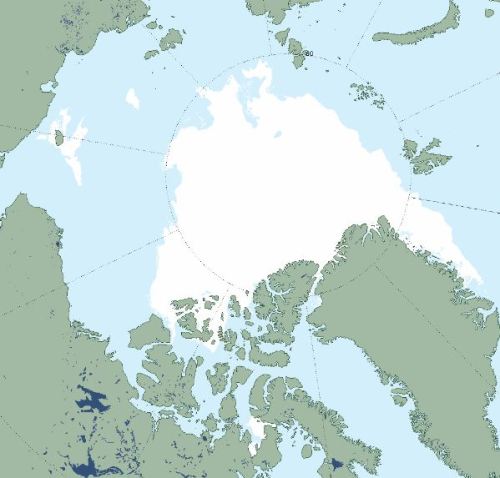
In other words, as far as can be determined, the low summer ice levels of 2012 in the Barents Sea (above) had zero impact on the health or survival of these bears in this region. There is therefore no reason to suggest this year (below) would be any different, especially since the previous ‘second lowest’ summer sea ice year of 2016 also produced no evidence of harm to Svalbard area bears.
Note that one of the reasons there has been no impact from such low summer ice is that there is a natural movement of Svalbard area pregnant females to the polar pack ice or to Franz Josef Land in the eastern Barents Sea when summer sea ice levels around Svalbard are low (Andersen et al. 2012; Derocher et al 2002). This behavioural response to changing sea ice conditions is normal for polar bears and is a critical feature of their success in an ever-changing Arctic habitat (Crockford 2015).
Chukchi Sea
The Chukchi Sea polar bear subpopulation is also considered by polar bear experts to be at high risk of population decline due to loss of summer ice (Amstrup et al. 2007; Durner et al. 2009). However, to the astonishment of polar bear researchers, Chukchi Sea polar bears are thriving by all measures used to assess individual and population heath despite marked declines in summer sea ice since 2007.
Body condition has been better in recent years than it was in the 1980s when there was a shorter ice-free period and females are reproducing well (Rode et al. 2013, 2014, 2018). A 2016 survey put the population size at about 3,000 bears, considerably higher than the estimate of about 2,000 bears used in the 2015 Red List assessment (AC SWG 2018; Regehr et al. 2016, 2018; Wiig et al. 2015). In August 2018, polar bear biologist Eric Regehr was quoted as saying:
“Chukchi bears remain larger and fatter and have not seen downward trends in cub production and survival, according to new preliminary information on the health and numbers of bears.”
This positive result for Chukchi Sea bears is a direct result of the fact that Chukchi Sea ringed and bearded seals – the primary prey of polar bears – were also found to be doing much better up to 2013 than they were in the 1980s when the open-water period was much shorter (Crawford and Quakenbush 2013; Crawford et al. 2015; Rode et al. 2018), and preliminary data from on-going studies suggest this continues to be the case (Adam et al. 2019). These results strongly contradict predictions that ringed and bearded seals numbers would decline markedly due to summer sea ice loss, which formed the basis of classifying both species of seals as ‘threatened‘ in the US in 2012 (USFWS 2008, 2012).
Arctic Archipelago
As I’ve pointed out previously, polar bears are almost certainly thriving in most areas of the Canadian Arctic Archipelago (CAA; ‘Archipelago’ areas in gold in the sea ice ecoregion map below). This is because the ice has changed from primarily multiyear ice in winter to first year ice (‘seasonal’) in most of the Archipelago region.

In 2007, US government biologists predicted that when summer sea ice declined dramatically by 2050, all of the polar bears in the green and purple regions would be wiped out, leaving only about 8,100 remaining.
First year ice over shallow water is overall the best habitat for polar bears because it is the best habitat for ringed seals in the winter and spring. The multiyear ice that dominated some areas of the CAA during the 1970s and 1980s (like Viscount Melville) kept densities of ringed and bearded seals low (Amstrup 2003: 593; Stirling and Øritsland 1995), which meant that polar bear populations were also low. However, several eastern regions of the CAA, like Lancaster Sound and the Gulf of Boothia, which have more seasonal ice mixed with multiyear ice, have much higher densities of seals and bears.
The shift from multiyear to first year ice in parts of the CAA has happened much sooner than expected. Wang and Overland (2012) used the same sea ice models used by USGS biologists to predict the future survival of polar bears based on habitat loss and they all expected ice in the CAA to persist up to 2030 even as ice in the Arctic Basin declined. But they were wrong: instead, multiyear ice has been scarce in the CAA in all but the northern-most region since 2007 (and especially in 2012, see below). This means that since 2007 much of the ice in the CAA has been the relatively ‘thin’ first year ice habitat (<2m thick) in which polar bears and ice seals thrive.

In 2005, about 5000 bears were thought to live in the Archipelago ecoregion (Amstrup et al. 2007): that number has almost certainly increased markedly, although only data from Kane Basin has been published. In Kane Basin, we now know the population more than doubled increased substantially even though bears went from having ice all summer long (>50% ice covered) in the 1990s to being virtually ice-free (<5% ice covered) for a month (SWG 2016:447, 464).

I previously suggested that polar bear numbers in M’Clintock Channel were likely to have changed by the largest percentage (like Kane Basin), while Gulf of Boothia and Lancaster Sound have probably changed much less.
We are still waiting for final reports and survey results from Gulf of Boothia (completed 2017), Viscount Melville (completed 2014), and M’Clintook Channel (completed 2016) (Crockford 2020). However, polar bear expert Ian Stirling recently admitted that the M’Clintook Channel population “seems to be increasing” (as I predicted), although the report with details on the study and the amount of increase has still not been made public.
Southern Hudson Bay
The newest rendition of polar bear survival predictions (using a complex climate model merged with a body condition model), recently suggested climate change could starve polar bears into extinction by 2100 but only because it used implausible climate model inputs (Hausfather and Peters 2020) and stale data. The model’s creators (Molnar et al. 2020) warned that some polar bear subpopulations, but especially Southern Hudson Bay, could face ‘reproductive failure’ due to an extended ice-free season within the next decade. However, because they based their model on seriously out-of-date information from Western Hudson Bay, the results generated do not reflect the fact that the ice-free season in western and southern Hudson Bay has been much shorter than it was in the early 2000s (and more like the 1980s for the last three years) and that conditions for Hudson Bay polar bears have been excellent for the last six years at least. The length of the ice-free season for Southern Hudson Bay polar bears is usually very similar to Western Hudson Bay.
Given recent conditions, including the late breakup of sea ice this summer in Western Hudson Bay and early freezeup for the last three years, reproductive failure for Southern Hudson Bay bears within 10 years seems very unlikely. An honest revision of the dates that polar bears move onshore and offshore (at sea ice breakup in summer and freeze-up in fall) for Western Hudson Bay (e.g. as presented by Castro de la Guardia and colleagues in 2017) will almost certainly show that the length of time that Hudson Bay polar bears spend onshore in summer has shortened since 2007. This change was not anticipated and polar bear experts seem to be struggling to come to terms with it, when they are not denying it is happening.
Conclusion
The lack of a negative response of polar bear populations to the abrupt decline of summer sea ice in 2012 – the lowest since 1979 – suggests that this year’s ‘second-lowest’ extent will be similarly non-eventful as far as polar bears are concerned. This ‘second-lowest’ extent is indeed part of a continued long-term decline since 1979 but it also maintains the continued pattern of sea ice coverage stalled at about 3-5 mkm2 since 2007, as the graph below from NSIDC shows, although CO2 levels have continued to rise.
This 3-5 mkm2 ice extent in September is the disaster that polar bear experts anticipated in 2007 and which they wrongly claimed would cause 2/3 of the world’s polar bears to disappear. In fact, contrary to all predictions, polar bears have been thriving in recent years despite reduced summer ice in the Barents, Chukchi and Southern Beaufort Seas, and because of unexpectedly short ice-free seasons in Hudson Bay and less multiyear ice in the Canadian Arctic Archipelago.

References
ACIA 2005. Arctic Climate Impact Assessment: Scientific Report. Cambridge University Press. See their graphics package of sea ice projections here.
Aars, J. 2018. Population changes in polar bears: protected, but quickly losing habitat. Fram Forum Newsletter 2018. Fram Centre, Tromso. Download pdf here (32 mb).
Aars, J., Marques,T.A, Lone, K., Anderson, M., Wiig, Ø., Fløystad, I.M.B., Hagen, S.B. and Buckland, S.T. 2017. The number and distribution of polar bears in the western Barents Sea. Polar Research 36:1. 1374125. doi:10.1080/17518369.2017.1374125
AC SWG 2018. Chukchi-Alaska polar bear population demographic parameter estimation. Eric Regehr, Scientific Working Group (SWG. Report of the Proceedings of the 10th meeting of the Russian-American Commission on Polar Bears, 27-28 July 2018), pg. 5. Published 30 July 2018. US Fish and Wildlife Service. https://www.fws.gov/alaska/fisheries/mmm/polarbear/bilateral.htm pdf here.
Adam, R., Bryan, A., Quakenbush, L., Crawford, J., and Biderman, L.2019. Bearded seal productivity in Alaska using harvest-based monitoring, 1975-2016. Poster presentation, Alaska Marine Science Symposium, 28 January-1 February.
Amstrup, S.C., Marcot, B.G. & Douglas, D.C. 2007. Forecasting the rangewide status of polar bears at selected times in the 21st century. US Geological Survey. Reston, VA. Pdf here
Andersen, M., Derocher, A.E., Wiig, Ø. and Aars, J. 2012. Polar bear (Ursus maritimus) maternity den distribution in Svalbard, Norway. Polar Biology 35:499-508.
Castro de la Guardia, L., Myers, P.G., Derocher, A.E., Lunn, N.J., Terwisscha van Scheltinga, A.D. 2017. Sea ice cycle in western Hudson Bay, Canada, from a polar bear perspective. Marine Ecology Progress Series 564: 225–233. http://www.int-res.com/abstracts/meps/v564/p225-233/
Crawford, J. and Quakenbush, L. 2013. Ringed seals and climate change: early predictions versus recent observations in Alaska. Oral presentation by Justin Crawfort, 28th Lowell Wakefield Fisheries Symposium, March 26-29. Anchorage, AK. Abstract below, find pdf here:http://seagrant.uaf.edu/conferences/2013/wakefield-arctic-ecosystems/program.php
Crawford, J.A., Quakenbush, L.T. and Citta, J.J. 2015. A comparison of ringed and bearded seal diet, condition and productivity between historical (1975–1984) and recent (2003–2012) periods in the Alaskan Bering and Chukchi seas. Progress in Oceanography 136:133-150.
Crockford, S.J. 2015. The Arctic Fallacy: Sea Ice Stability and the Polar Bear. Global Warming Policy Foundation Briefing Paper 16. London. Pdf here. Available at http://www.thegwpf.org/susan-crockford-the-arctic-fallacy-2/
Crockford, S.J. 2019. The Polar Bear Catastrophe That Never Happened. Global Warming Policy Foundation, London. Available in paperback and ebook formats.
Crockford, S.J. 2020. State of the Polar Bear Report 2019. Global Warming Policy Foundation Report 39, London. pdf here.
Derocher, A.E., Wiig, Ø., and Andersen, M. 2002. Diet composition of polar bears in Svalbard and the western Barents Sea. Polar Biology 25 (6): 448-452. http://link.springer.com/article/10.1007/s00300-002-0364-0
Durner, G.M., Douglas, D.C., Nielson, R.M., Amstrup, S.C., McDonald, T.L., et al. 2009. Predicting 21st-century polar bear habitat distribution from global climate models. Ecology Monographs 79: 25–58.
Hausfather, Z. and Peters, G.P. 2020. Emissions – the ‘business as usual’ story is misleading [“Stop using the worst-case scenario for climate warming as the most likely outcome — more-realistic baselines make for better policy”]. Nature 577: 618-620.
Lippold, A., Bourgeon, S., Aars, J., Andersen, M., Polder, A., Lyche, J.L., Bytingsvik, J., Jenssen, B.M., Derocher, A.E., Welker, J.M. and Routti, H. 2019. Temporal trends of persistent organic pollutants in Barents Sea polar bears (Ursus maritimus) in relation to changes in feeding habits and body condition. Environmental Science and Technology 53(2):984-995.
Molnar, P.K., Derocher, A.E., Theimann, G., and Lewis, M.A. 2010. Predicting survival, reproduction and abundance of polar bears under climate change. Biological Conservation 143:1612-1622.
Regehr, E.V., Laidre, K.L, Akçakaya, H.R., Amstrup, S.C., Atwood, T.C., Lunn, N.J., Obbard, M., Stern, H., Thiemann, G.W., & Wiig, Ø. 2016. Conservation status of polar bears (Ursus maritimus) in relation to projected sea-ice declines. Biology Letters 12: 20160556. http://rsbl.royalsocietypublishing.org/content/12/12/20160556 Supplementary data here.
Regehr, E.V., Hostetter, N.J., Wilson, R.R., Rode, K.D., St. Martin, M., Converse, S.J. 2018. Integrated population modeling provides the first empirical estimates of vital rates and abundance for polar bears in the Chukchi Sea. Scientific Reports 8 (1) DOI: 10.1038/s41598-018-34824-7 https://www.nature.com/articles/s41598-018-34824-7
Rode, K.D., Douglas, D., Durner, G., Derocher, A.E., Thiemann, G.W., and Budge, S. 2013. Variation in the response of an Arctic top predator experiencing habitat loss: feeding and reproductive ecology of two polar bear populations. Oral presentation by Karyn Rode, 28th Lowell Wakefield Fisheries Symposium, March 26-29. Anchorage, AK.
Rode, K.D., Regehr, E.V., Douglas, D., Durner, G., Derocher, A.E., Thiemann, G.W., and Budge, S. 2014. Variation in the response of an Arctic top predator experiencing habitat loss: feeding and reproductive ecology of two polar bear populations. Global Change Biology 20(1):76-88. http://onlinelibrary.wiley.com/doi/10.1111/gcb.12339/abstract
Rode, K. D., R. R. Wilson, D. C. Douglas, V. Muhlenbruch, T.C. Atwood, E. V. Regehr, E.S. Richardson, N.W. Pilfold, A.E. Derocher, G.M Durner, I. Stirling, S.C. Amstrup, M. S. Martin, A.M. Pagano, and K. Simac. 2018. Spring fasting behavior in a marine apex predator provides an index of ecosystem productivity. Global Change Biology http://onlinelibrary.wiley.com/doi/10.1111/gcb.13933/full
Stirling, I. and Øritsland, N. A. 1995. Relationships between estimates of ringed seal (Phoca hispida) and polar bear (Ursus maritimus) populations in the Canadian Arctic. Canadian Journal of Fisheries and Aquatic Sciences 52: 2594 – 2612. http://www.nrcresearchpress.com/doi/abs/10.1139/f95-849#.VNep0y5v_gU
SWG [Scientific Working Group to the Canada-Greenland Joint Commission on Polar Bear]. 2016. Re-Assessment of the Baffin Bay and Kane Basin Polar Bear Subpopulations: Final Report to the Canada-Greenland Joint Commission on Polar Bear. +636 pp. http://www.gov.nu.ca/documents-publications/349
US Fish and Wildlife Service (USFWS). 2008. Determination of threatened status for the polar bear (Ursus maritimus) throughout its range. Federal Register 73: 28212-28303.
US Fish and Wildlife Service (USFWS). 2012. Threatened status for the Arctic, Okhotsk and Baltic subspecies of the ringed seal. Federal Register 77: 76706–76738.
US Fish and Wildlife Service (USFWS) 2013. Polar Bear News 2013-14. Newsletter of the US Fish & Wildlife Service, Anchorage, Alaska. Pdf here.
Wang, M. and Overland, J. E. 2012. A sea ice free summer Arctic within 30 years: An update from CMIP5 models. Geophysical Research Letters 39: L18501. doi:10.1029/2012GL052868
Wiig, Ø., Amstrup, S., Atwood, T., Laidre, K., Lunn, N., Obbard, M., et al. 2015. Ursus maritimus. The IUCN Red List of Threatened Species 2015: e.T22823A14871490. Available from http://www.iucnredlist.org/details/22823/0 [accessed Nov. 28, 2015]. See the supplement for population figures.


You must be logged in to post a comment.