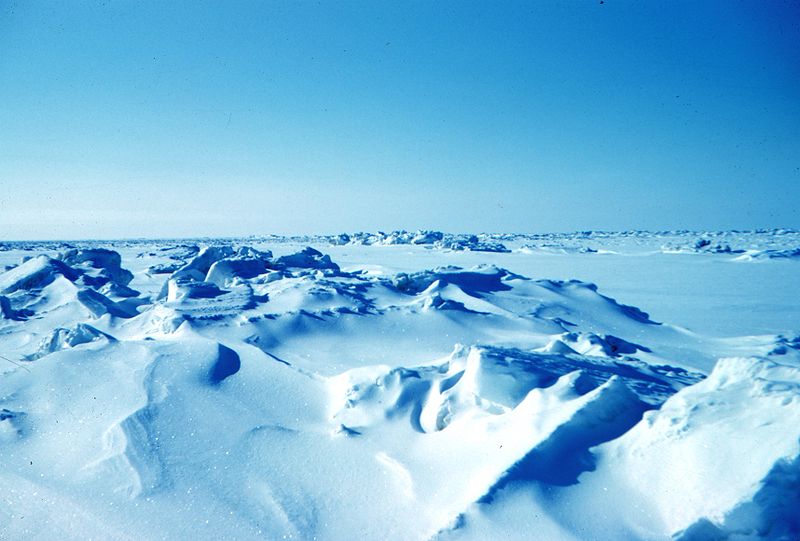
Now that we have a plausible explanation (previous post here) for why shorefast ice in the Eastern Beaufort got too thick for ringed seals every ten years or so, it’s time to talk about the effect that this recurring sea ice phenomenon might have had on polar bear population numbers.
We know from the reports of polar bear biologists that without fat young seals to eat in the spring, some bears in those thick-ice springs came close to starving and many mothers lost all or most of their cubs (Amstrup et al. 2006; Stirling 2002; Stirling and Lunn 1997; Stirling et al. 1980; Stirling et al. 2008). This presumably had some impact on population numbers – the question is: how bad was it?
None of the reports on the effects of the thick ice have given us any indication of how many polar bears might have died or lost their cubs. However, Ian Stirling and colleagues (Stirling et al. 2011) recently published a paper on the Northern Beaufort subpopulation that looked, at first glance, to have done just that.
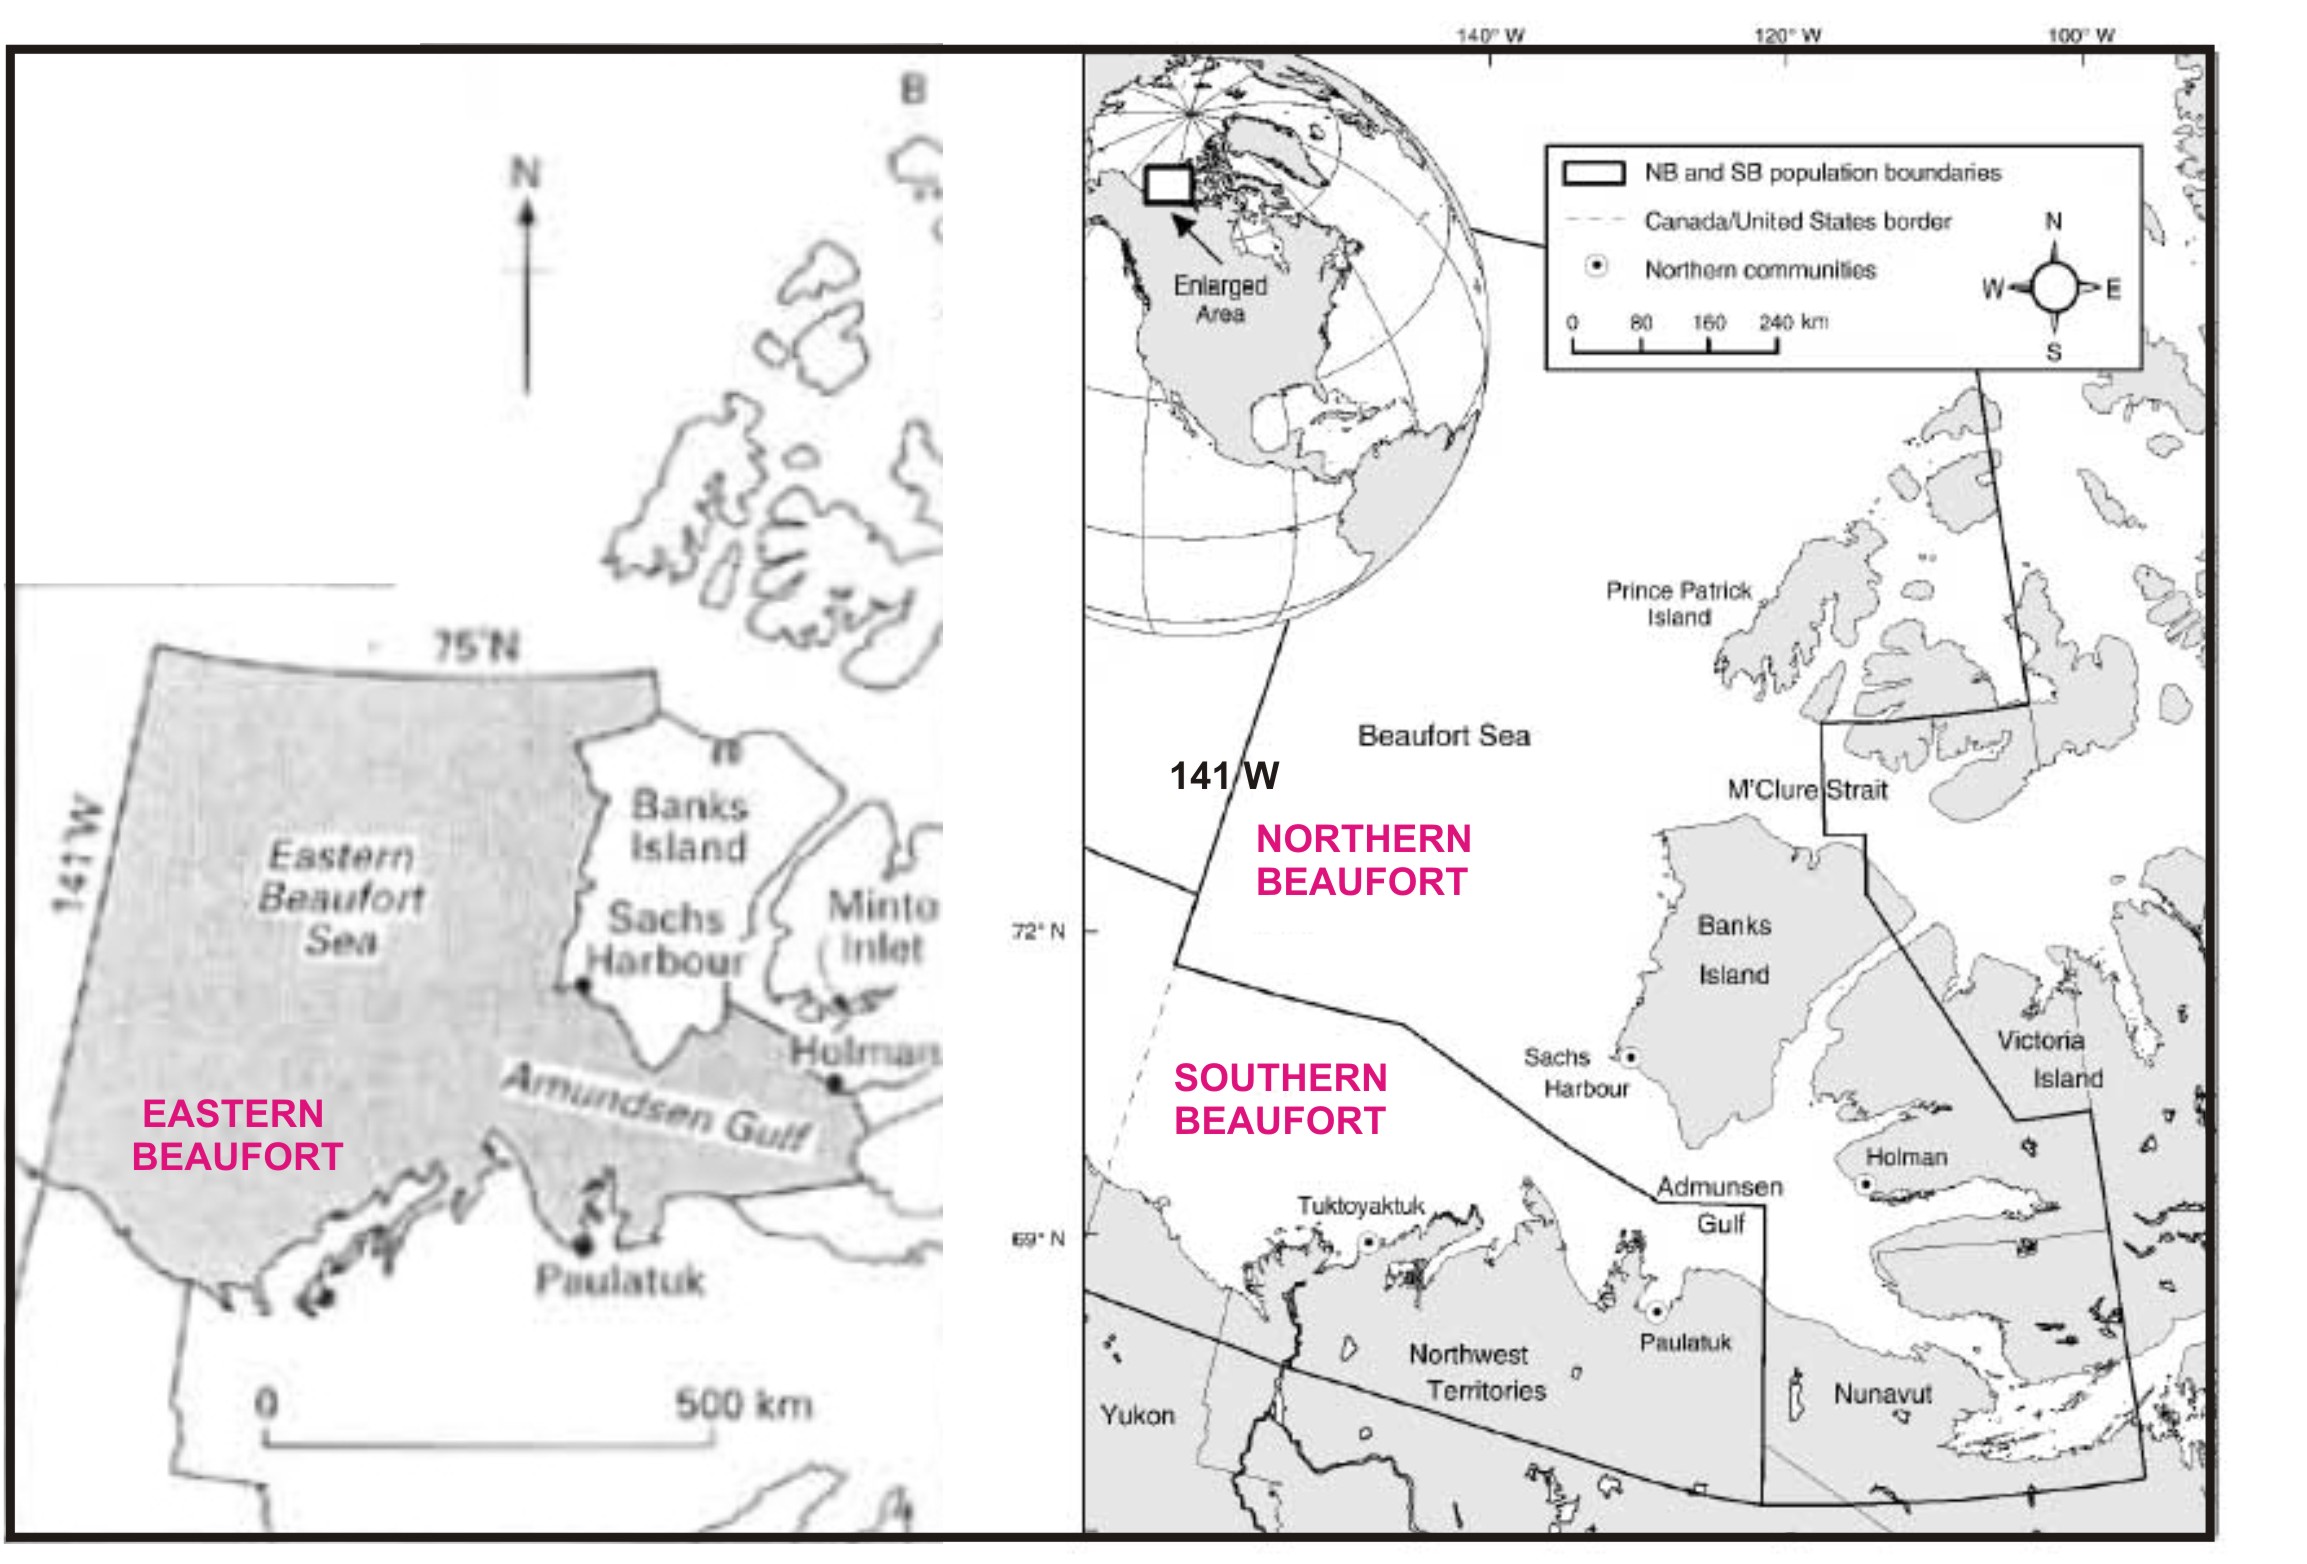
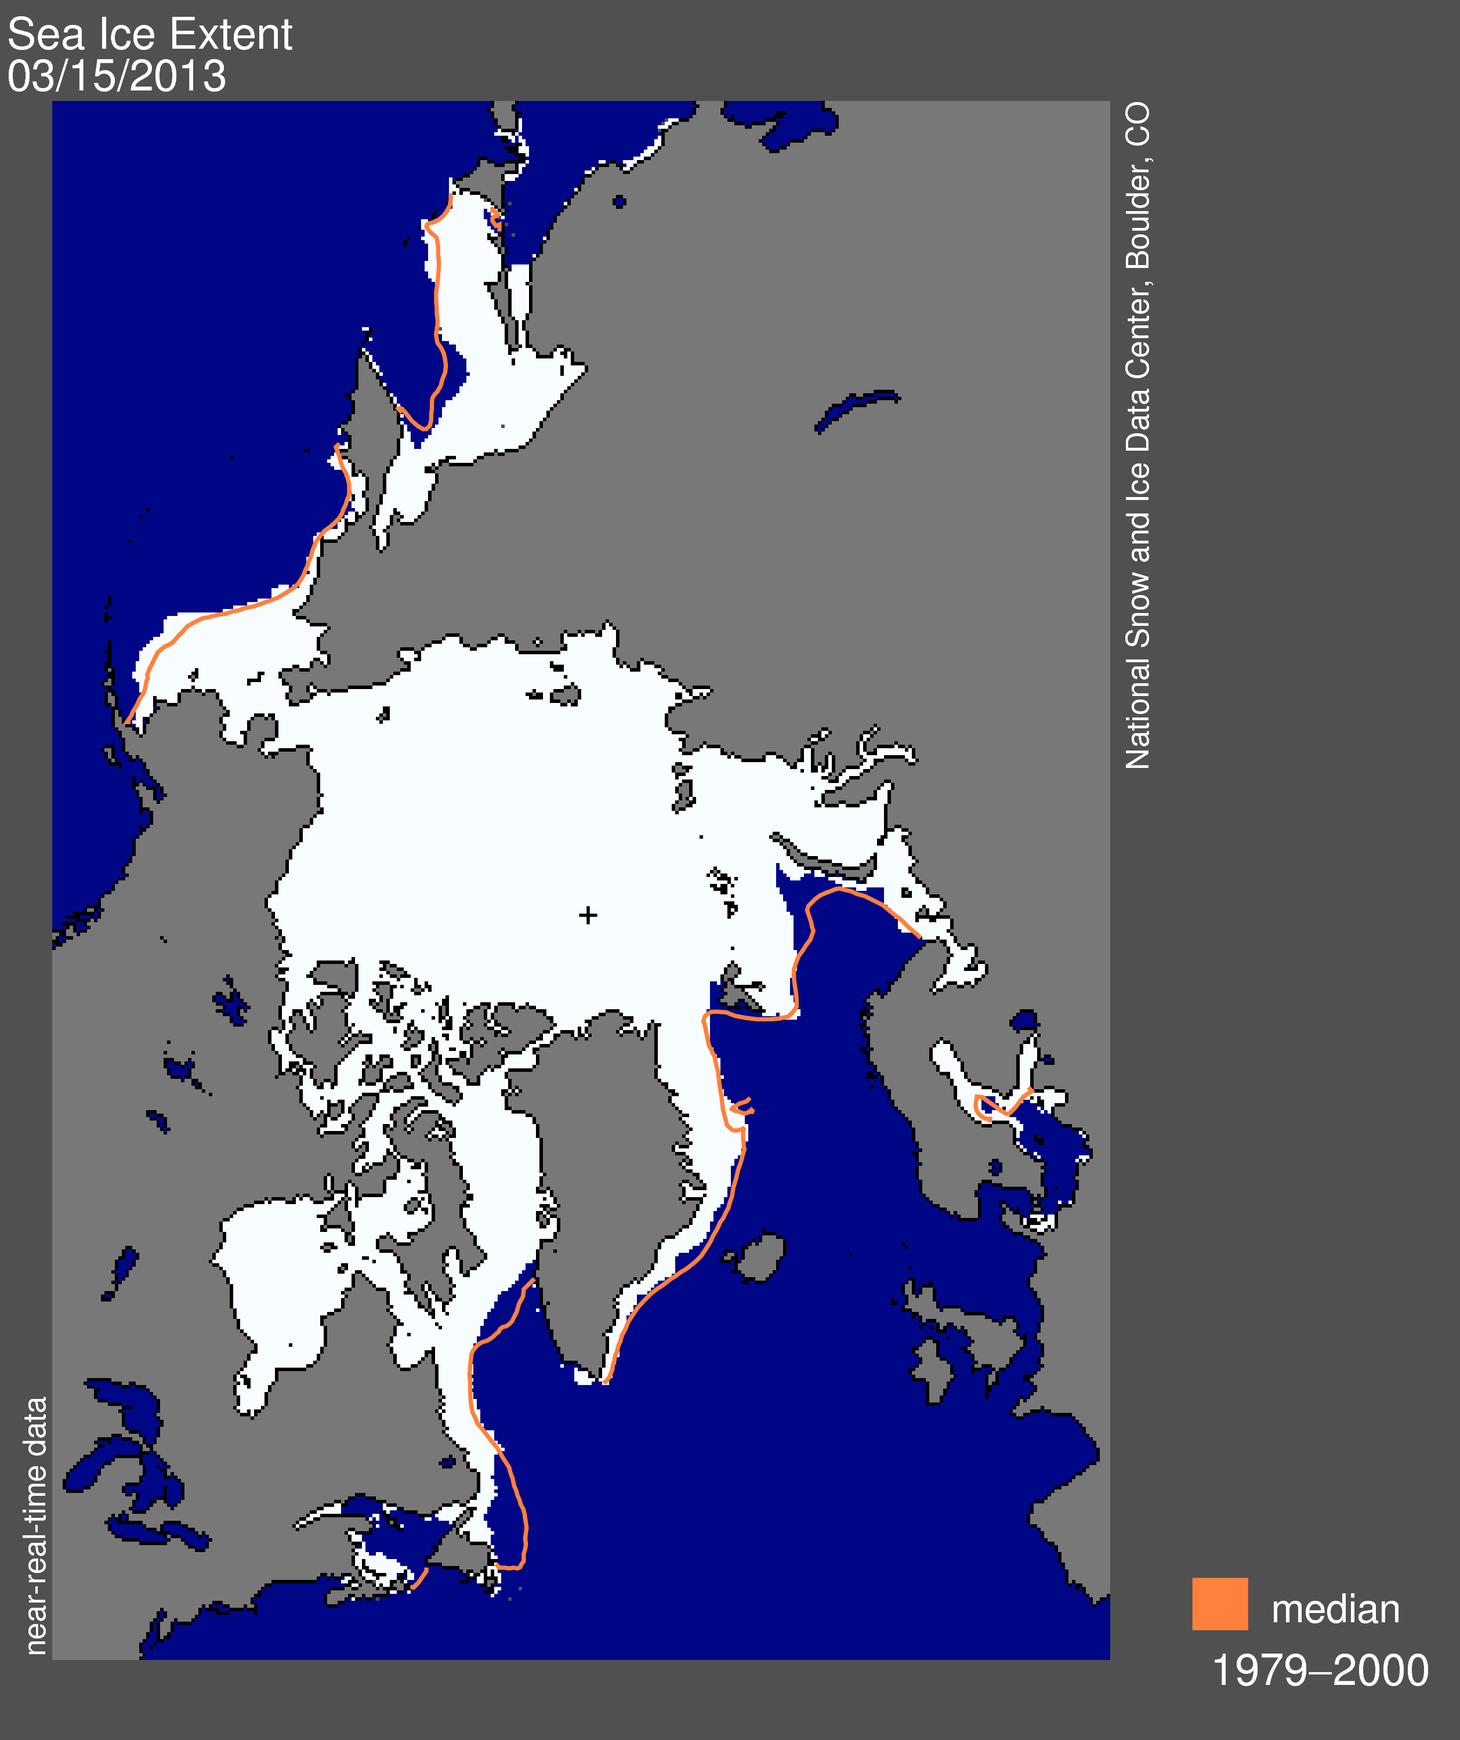
You have to keep in mind that the geographic area in question – the Eastern Beaufort – is not an official polar bear subpopulation region – at least, not any more. As Fig. 1 below shows, the Eastern Beaufort was once its own, strictly Canadian region (or at least, a strictly Canadian research region) see previous post here), but management is now shared between two subpopulations and managed by two governments (Canada and the USA). About half of the bears of the “Eastern Beaufort” reside in the ‘Northern Beaufort’ subpopulation and the other half live in the ‘Southern Beaufort’ subpopulation.
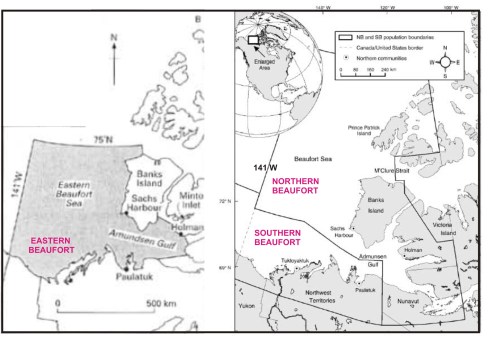
Figure 1. Re-jigging of polar bear subpopulations now splits what used to be an entirely a Canadian research segment, called the “Eastern Beaufort” (map on the left, from Stirling and Lunn 1997), into management regions called “Southern Beaufort” (shared with the USA) and “Northern Beaufort,” with the Canada-USA border at 141 W (map on the right, from Stirling et al. 2011, Fig. 1). Labels added. Most of the polar bears sampled for the Stirling et al. paper were captured along the west and south coasts of Banks Island, although a few were captured in M’Clure Strait and in Amundsen Gulf.
Despite the changing boundaries, ringed seals and polar bears in the Eastern Beaufort have been the focus of research since the early 1970s. In part, this is because the region has been targeted for oil exploration and studies on both species have been part of the associated ecological impact assessments (Stirling et al. 1993).
Getting back to the point, did Stirling et al. 2011 find fluctuations in polar bear numbers in the Northern Beaufort that might reflect the periodic bouts of thick spring ice in the Eastern Beaufort? Unfortunately, no — the data lack necessary precision. You’ll see why, I think, from the summary below. Continue reading


You must be logged in to post a comment.