Tag Archives: Davis Strait

Good news about Chukchi Sea polar bears whispered by US Fish & Wildlife Service

Just out: the “accepted” version of the Rode et al. paper discussed here last month — detailing just how well polar bears in the Chukchi Sea subpopulation are doing, despite recent declines in sea ice.

However, what was decidedly odd was how I found out about it.

Yesterday (Aug 28), while looking for something else, I found a “press release” tweeted by World Wildlife Fund (WWF) employee Geoff York, who is now also a full voting member of the Polar Bear Specialist Group (PBSG).

Chukchi bears press release tweet_Geoff York Aug 28 2013

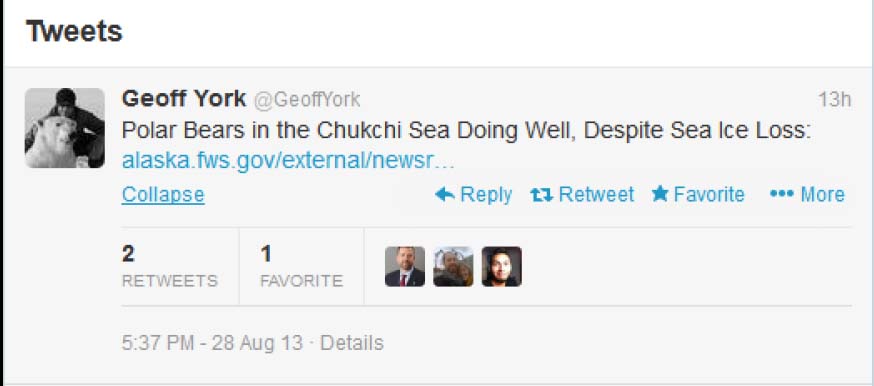
The announcement that York tweeted is listed as “alaska.fws.gov/external/newsroom/pdf/cs_polar_bear_article.pdf” and I found a stand-alone copy of the pdf with that title on Google.

However, FWS has so far (Aug. 29, 7:00 am PT) not mentioned this item on their [central] website, their twitter account, or their Facebook page (pdf here, with its original title). The “press release” has no date and is not on FWS letterhead but is authored by “Eric V. Regehr, U.S. Fish & Wildlife Service.” [I guess FWS employees can issue their own press releases?] UPDATE: Found it finally in the “FWS Alaska region” (Alaska FWS, posted Aug. 22, 2013, which included the Eric Regehr summary tweeted by York), via a news report at SitNews dated Aug. 27. Mystery solved]

Also odd that so far, no one except Geoff York himself seems to have picked it up (nothing so far on WWF website or Facebook page, Polar Bears International pages, or at ScienceDaily. [Update: see news report at SitNews dated Aug. 27. Still odd that the FWS report has been sitting there quietly since the 22nd (Thursday of last week)]

Not exactly how I’d choose to spread good news, but perhaps that’s the point.

Nevertheless, not too much new in the paper itself [contact me if you’d like a copy] – no population size estimate, for example – other than what I included in the summary provided last month (based on a March presentation by lead author Karyn Rode), except this: spring litter sizes [1.90 in 2007 and 2.17 in 2009 on Wrangel Island] were “are among the highest reported for 18 of 19 polar bear populations” and were similar to litter sizes 20 years earlier.

I guess the picture of the Chukchi female with a litter of triplet yearling cubs included without mention in the 2010 Rode and Regehr report (pdf here, copied below, discussed previously here) was significant after all.

Rode and Regehr 2010_Chukchi_report2010_Fig1_triplets_labelled

Continue reading

Polar bears have not been harmed by sea ice declines in summer – the evidence

PB  logo colouredThe polar bear biologists and professional activists of the IUCN Polar Bear Specialist Group (PBSG) continue to insist that since 1979 increasingly smaller amounts of Arctic sea ice left at the end of summer (the September ice minimum) have already caused harm to polar bears. They contend that global warming due to CO2 from fossil fuels (“climate warming” in their lexicon) is the cause of this decline in summer ice.

In a recent (2012) paper published in the journal Global Change Biology (“Effects of climate warming on polar bears: a review of the evidence”), long-time Canadian PBSG  members Ian Stirling and Andrew Derocher (both of University of Alberta) summarized their position this way:

“Climate warming is causing unidirectional changes to annual patterns of sea ice distribution, structure, and freeze-up. We summarize evidence that documents how loss of sea ice, the primary habitat of polar bears (Ursus maritimus), negatively affects their long-term survival”

I’ve spent the last year examining their evidence of on-going harm, but in addition, I’ve looked at the evidence (much of it not mentioned in the Stirling and Derocher paper1) that polar bears have either not been harmed by less sea ice in summer or have thrived in spite of it.

This is a summary of my findings. I’ve provided links to my original essays on individual topics, which are fully referenced and illustrated. You are encouraged to consult them for complete details. This synopsis (pdf with links preserved, updated; pdf with links as footnotes, updated) complements and updates a previous summary, “Ten good reasons not to worry about polar bears” (pdf with links preserved; pdf with a foreword by Dr. Matt Ridley, with links as footnotes).

Update 8 September 2013: to include links to my post on the recently published Chukchi population report; updated pdfs have been added above.

Update 22 January 2014: added figure comparing March vs. September sea ice extent using the same scale, from NOAA’s “2014 Arctic Report Card,” discussed here.
Continue reading

Baffin Bay polar bear status – waiting for the count

Here’s a quick summary of the status of Baffin Bay polar bears, a subpopulation I’ve not previously discussed in detail. Nothing especially earth-shattering here, except perhaps to wonder about the involvement of the World Wildlife Fund (WWF) in a new helicopter survey of the region.

Baffin Bay (Fig. 1) is north of Davis Strait. It lies between western Greenland and Baffin Island in the eastern Arctic.

Unlike the other north/south neighbour-pair of Western/Southern Hudson Bay   (which I discussed previously), the sea ice history for Baffin Bay/Davis Strait is not as similar: Davis Strait bears have a much longer on-shore fast than Baffin Bay bears (see last post here). However, all four of these subpopulations have ‘seasonal sea ice’ – that is, the ice melts completely in late mid-to-late summer, forcing bears onshore for varying lengths of time until fall freeze-up.

Figure 1. The Baffin Bay subpopulation region lies north of Davis Strait (map on the left from Vongraven and Peacock 2011: Fig. 3) and management is shared between Canada (Nunavut) and Greenland. In total area, it covers 1.08 million km2 and its “suitable ice habitat in spring” (according to Taylor and Lee 1995) is 413,500 km,2 somewhat less than Davis Strait. The map on the right shows the sea ice extent at the end of March 2010 (NSIDC), the winter maximum.

Figure 1. The Baffin Bay subpopulation region lies north of Davis Strait (map on the left from Vongraven and Peacock 2011: Fig. 3) and management is shared between Canada (Nunavut) and Greenland. In total area, it covers 1.08 million km2 and its “suitable ice habitat in spring” (according to Taylor and Lee 1995) is 413,500 km2, somewhat less than Davis Strait. The map on the right shows the sea ice extent at the end of March 2010 (NSIDC), the winter maximum.

A peer-reviewed paper published last year (Rode et al. 2012) compared body condition vs. sea ice changes in Davis Strait and Baffin Bay (discussed here). But while that research contributed to an updated population estimate for Davis Strait (Peacock et al. 2013, discussed here), it did not do the same for Baffin Bay. This is likely because the body condition work in Baffin Bay was split between spring and fall, and it has already been determined that many Baffin Bay bears are offshore in the spring and not available for counting using shore-based methods.

That’s a shame, because the last population estimate was completed back in 1997 (Taylor et al. 2005) and it is now seriously out of date.

However, it appears the Government of Nunavut is currently in the process of surveying this region by helicopter, so a new population estimate should be available soon.

But this aspect of the survey might surprise you — a press release issued February 11, 2013 by WWF contained the following statement:

Results from the above-noted surveys will be completed and shared beginning in April 2013.

WWF made contributions of $82,000 to the Government of the Northwest Territories and $111,000 to the Government of Nunavut via Environment Canada, towards the total costs of these surveys. These funds were raised through the Arctic Home campaign from engaged Canadians and matched by The Coca-Cola Company.”  [my bold]

So, of the hundreds of millions the WWF pulls in from donations, they passed along less than $100,000 [$96,500 plus an equal contribution by Coca-Cola) to offset “the total costs of the survey.

We are not told what those total costs are, but I expect they run well over a million dollars for a multiyear/multi-region project like this, perhaps over two million. Which makes $96,500 rather a drop in the bucket. That might have paid for some of the jet fuel for the helicopters used for the survey, but probably not all of it.

Status details below.
Continue reading

Baffin Bay-Davis Strait ice concentration comparison – why use the “summer mean”?

I’ve been in the process of looking at the status of polar bears in the Baffin Bay region, which lies to the north of Davis Strait (Fig. 1), but a related issue caught my attention that I think deserves discussion.

Figure 1. Polar bear subpopulations defined by the Polar Bear Specialist Group (PBSG). Note that Baffin Bay, Davis Strait, Western Hudson Bay and Southern Hudson Bay are all similar in that they become ice-free by early fall (the September minimum) or before.

Figure 1. Polar bear subpopulations defined by the Polar Bear Specialist Group (PBSG). Note that Baffin Bay, Davis Strait, Western Hudson Bay and Southern Hudson Bay are all similar in that they become ice-free by early fall (the September minimum) or even before.

Recall that in a recent post on the Beaufort Sea ice extent comparison offered by the National Snow and Ice Data Center (NSIDC) here, I commented:

What puzzled me was why they featured only the last 7 years when satellite data go back to at least 1979. Is there something in that data they don’t want us to see?”

Something similar struck me about the analysis of sea ice in Baffin Bay and Davis Strait conducted by polar bear researchers Karyn Rode and colleagues (Rode et al. 2012). In their comparison of body condition (relative fatness) of bears in Davis Strait and Baffin Bay (see previous post here), they introduced an entirely new sea ice metric – “mean daily summer sea ice concentration,” defined as the mean of values between May 15 and October 15 each year based on ice charts provided by the Canadian Ice Service.

Why invent a metric that has never been used (as far as I know) for analysis of polar bear health, survival or success?

Why not use breakup dates, as has been done for decades for subpopulations in Hudson Bay (e.g. Cherry et al. 2013), where the ice also disappears in late summer?

Is there something in the ice data for Baffin Bay and Davis Strait that Rode and colleagues don’t want us to see?

Since I had already made a composite of Cryosphere Today ice maps at July 12 for my discussion of the Chukchi/Beaufort NSIDC analysis mentioned above, it was relatively easy to look at what was going on in Baffin Bay and Davis Strait on that date in mid-summer. Keep in mind that ice extent and concentration at July 12 records the state of polar bear habitat prior to the late summer decline in sea ice that occurs every year.

Continue reading

Southern Hudson Bay subpopulation status, farthest south of all polar bears

“The Arctic” is a bit hard to define. While the Arctic Circle works as a good boundary for some purposes and the 100C isotherm for July for others, neither work for polar bears because several subpopulations live well south of these limits (Fig. 1).

In the east, Western Hudson Bay, Southern Hudson Bay and Davis Strait are all located well south of the Arctic Circle and the first two (and half of Davis Strait) are beyond the 100C July isotherm as well. In the western Arctic, the Chukchi Sea subpopulation is within the 100C July isotherm but at least half of its bears reside south of the Arctic Circle (Fig. 1) in the Bering Sea (see previous post here).

Unique amongst all of these is Southern Hudson Bay – all of its polar bears make maternity dens and/or spend the summer south of 600N.

Southern Hudson Bay (SH) bears live in the Canadian provinces of Ontario, while Western Hudson Bay (WH) bears reside in Manitoba and Nunavut. The two groups mix over the winter but appear to spend the summer/fall in their respective regions (Stirling et al. 2004). [See previous posts on Western Hudson Bay bears here, here, and here]

“Further south” in the Arctic usually means warmer, with open water present more weeks every summer, sea ice for fewer weeks over the winter. So, shouldn’t the bears of Southern Hudson Bay be already suffering more harm from global warming than virtually all other subpopulations, including those in Western Hudson Bay?

After all, Western Hudson Bay bears appear to have experienced a statistically significant decline in numbers, among other effects (Regehr et al. 2007; Stirling and Derocher 2012) — surely Southern Hudson Bay bears are doing worse?

You’d think so, but they aren’t.

Figure 1. Boundary limits for “the Arctic” (top map) such as the Arctic Circle (dashed line) or the 100C isotherm for July (solid red line) would not include several polar bear subpopulations that live south of these.

Figure 1. Boundary limits for “the Arctic” (top map) such as the Arctic Circle (dashed line) or the 100C isotherm for July (solid red line) would not include several polar bear subpopulations that live south of these.

UPDATED October 28, 2014: Reference added, Obbard et al. 2013 (aerial survey results).
Continue reading

Gulf of Boothia, unheralded Arctic utopia, has the highest density of polar bears worldwide

The issue of polar bear population density (# of bears per 1000 km2) came up a few posts ago, during my discussion of the new Davis Strait population study by Lily Peacock and colleagues (here). Since the various polar bear subpopulations across the Arctic are so different in size, calculating the density of bears in the various regions generates an interesting metric of how well the regional populations are doing relative to each other.

Almost 20 years ago, Taylor and Lee (1995) did just that: they determined the density of polar bears in the various Canadian subpopulations, as of the 1990s. Surprisingly, the ‘leader’ among those, by a wide margin, was one of the smallest in geographic area: the Gulf of Boothia. Located in the central Canadian Arctic (see Figs. 1 and 2 below), in the 1990s, tiny Gulf of Boothia supported a density of 10.4 polar bears per 1000 km2, the highest density of all regions examined.

 Figure 1. The Gulf of Boothia (circled) is right in the middle of the Canadian Arctic. In terms of geographic area, it is one of the smallest of all 19 subpopulations worldwide: at only 170,000 km2, only the Norwegian Bay and Kane Basin subpopulation regions, also in Canada (just to the north of Gulf of Boothia), are smaller at 150,000 and 155,000 km2 respectively (Vongraven and Peacock 2011). The Gulf of Boothia supports the highest density of polar bears known.Modified from map of polar bear protected areas provided by Environment Canada.


Figure 1. The Gulf of Boothia (circled) is right in the middle of the Canadian Arctic. In terms of geographic area, it is one of the smallest of all 19 subpopulations worldwide: at only 170,000 km2, only the Norwegian Bay and Kane Basin subpopulation regions, also in Canada (just to the north of Gulf of Boothia), are smaller at 150,000 and 155,000 km2 respectively (Vongraven and Peacock 2011). The Gulf of Boothia supports the highest density of polar bears known. Modified from the map of polar bear protected areas provided by Environment Canada.

But this density value for Gulf of Boothia was based on the 1986 population estimate of 900 bears – what is the most current figure?

For that, we need an updated population assessment. That was done in 2000 and it generated an estimate of 1,592 ± 361 bears (Taylor et al. 2009).

Taylor et al. (2009:791) said this about their assessment:

Our results suggest population size had increased steadily under a harvest regimen of approximately 40 bears/yrand added, “Barber and Iacozza (2004) found no trends in Gulf of Boothia sea ice conditions or ringed seal habitat suitability indices in the interval 1980-2000.

In other words, despite there being no trend in either sea ice conditions or habitat for seals – and a yearly harvest of 40 bears – polar bear numbers in the Gulf of Boothia increased significantly (by almost 700 bears) during the twenty years between 1980 and 2000. Even if the 1986 estimate of approximately 900 bears was somewhat less accurate than the more recent one, the fact that tiny Gulf of Boothia can support 1,592 bears is surely a remarkable feat.

Using this new population estimate and the same area of ‘available habitat’ used by Taylor and Lee in 1995, I calculated the most recent density at a spectacular 18.3 bears per 1000 km2! [note this is exactly what Peacock et al (2013) did to get their density value of 5.1 bears/1000 km2, discussed here.] But I didn’t update just Gulf of Boothia, I did them all.

The updated density values for Gulf of Boothia and several other Canadian subpopulations are listed in Table 1 below. Note that aside from Davis Strait, as far as I know these density figures have not been published elsewhere: you’re seeing them here for the first time.

Continue reading

Davis Strait polar bears again: body condition declined while population increased

This is a short follow-up to my last post on Davis Strait polar bears.

Today I’ll highlight a paper published last year (Rode et al. 2012) that had three of the same co-authors as the Peacock et al. (2012) paper I discussed on Monday – Lily Peacock, Mitch Taylor, and Ian Stirling contributed to both papers. Rode et al. (2012) deals with the issue of body condition (relative degree of fatness) in polar bears vs. changing levels of sea ice over time, and if you’ll pardon the pun, adds even more weight to the conclusion that declines in summer sea ice do not necessarily spell the disaster for polar bears we have been told is inevitable.

A polar bear near Thule, NW Greenland. Note the decidedly chubby back end on this bear, who looks well prepared for winter. Photo by Robin Davies. [details at my Quote Archive, Featured Quote #6]

A polar bear in the summer of 2012 near Thule, NW Greenland (part of the Baffin Bay subpopulation). Note the decidedly chubby back end on this bear, who looks well prepared for winter. Photo by Robin Davies.
[details at my Quote Archive, Featured Quote #6]

Continue reading

Signs that Davis Strait polar bears are at carrying capacity

Exciting news about polar bears in eastern Canada: the peer-reviewed paper on the Davis Strait subpopulation study has finally been published (Peacock et al. 2013). It concludes that despite sea ice having declined since the 1970s, polar bear numbers in Davis Strait have not only increased to a greater density (bears per 1,000 km2) than other seasonal-ice subpopulations (like Western Hudson Bay), but it may now have reached its ‘carrying capacity.’

This is great news. But where is the shouting from the roof-tops? This peer-reviewed paper (with its juicy details of method and analysis results), considered by some to be the only legitimate format for communicating science, was published February 19, 2013. No press release was issued that I could find and consequently, there was no news coverage. Funny, that.

There was a bit of shouting back in 2007 when the study ended and the preliminary population count was released – polar bear biologist Mitch Taylor is quoted in the Telegraph (March 9 2007) as saying:

“There aren’t just a few more bears. There are a hell of a lot more bears.”

There was also a CBC news item in January 2007 and a Nunatsiaq|Online report in October 2009 when the official government report was completed. But these were all based on preliminary information and focused on the population increase only.

This new paper (Peacock et al. 2013) reveals that the story in Davis Strait is about more than simple population growth. Small wonder no one is drawing attention to it. Continue reading

Western Hudson Bay polar bears are not like the others – Part 2

In Part 1 of the Western Hudson Bay (WHB) polar bear story, I promised to explore the idea that rather than declining due to the effects of global warming, WHB polar bear populations may simply be returning to ‘normal’ after the rapid population increase that followed the intense over-harvests that occurred between 1890 and 1930 and again from 1945 to 1970.

Derocher and Stirling (1995:1664) had this to say about the life history features (like incidence of triplets and age of weaning) that made the polar bears of WHB unique:

The results of our analyses suggest that the unique reproductive characteristics of polar bears in western Hudson Bay in the 1960s and 1970s were either a function of a population increasing from a depleted state and feeding on a relatively abundant prey base, or density-independent fluctuations in prey population size, or availability due to sea ice variation.

In my last post, I discussed some of the evidence for how polar bear reproductive characteristics had changed since 1985. But how different were WHB polar bears, before and after 1985, from the other populations that had been dramatically reduced between 1890 and 1970, such as those in Svalbard/Barents Sea and Davis Strait?

There are two factors to consider in this recovery from over-harvest: population size changes and reproductive characteristics. Turns out, we don’t know much about the Davis Strait subpopulation but we do know a bit about Svalbard/Barents Sea bears since the 70s. And the Svalbard/Barents Sea vs. WHB comparison is a bit of an eye-opener.
continue reading

The slaughter of polar bears that rarely gets mentioned (ca. 1890-1930)

Chock this post up as another example of mind-blowing information you sometimes find while looking for something else.

In their dendrochronology paper on trees associated with polar bear dens in western Hudson Bay, Scott and Stirling (2002:157) reference an MA thesis in Geography by James Honderich (1991), in regards to a discussion of denning frequency during the period 1850-1899, “when polar bear hides were more or less traded consistently.”

It turns out the James Honderich’s thesis is actually a summary of polar bear harvests in Canada from about 4,000 years ago to 1935. The number of polar bears taken by Arctic explorers (1594 to mid-1900s), Hudson’s Bay Company fur traders (from 1670 to 1935) and Arctic whalers (1820s-1935) were calculated from a variety of historical sources. This post is a summary of the results for the period 1800-1935. It is likely you have never seen this astonishing information before and the implications for polar bear biology are substantial. Continue reading