The official population estimates generated by the IUCN Polar Bear Specialist Group (PBSG) give the impression that the global total of polar bears has not changed appreciably since 2001:
2001 PBSG report 21,500-25,000
2005 PBSG report 20,000-25,000
2009 PBSG report 20,000-25,000
2013 PBSG website 20,000-25,000
2015 IUCN Red List 22,000-31,000 [see latest update note]
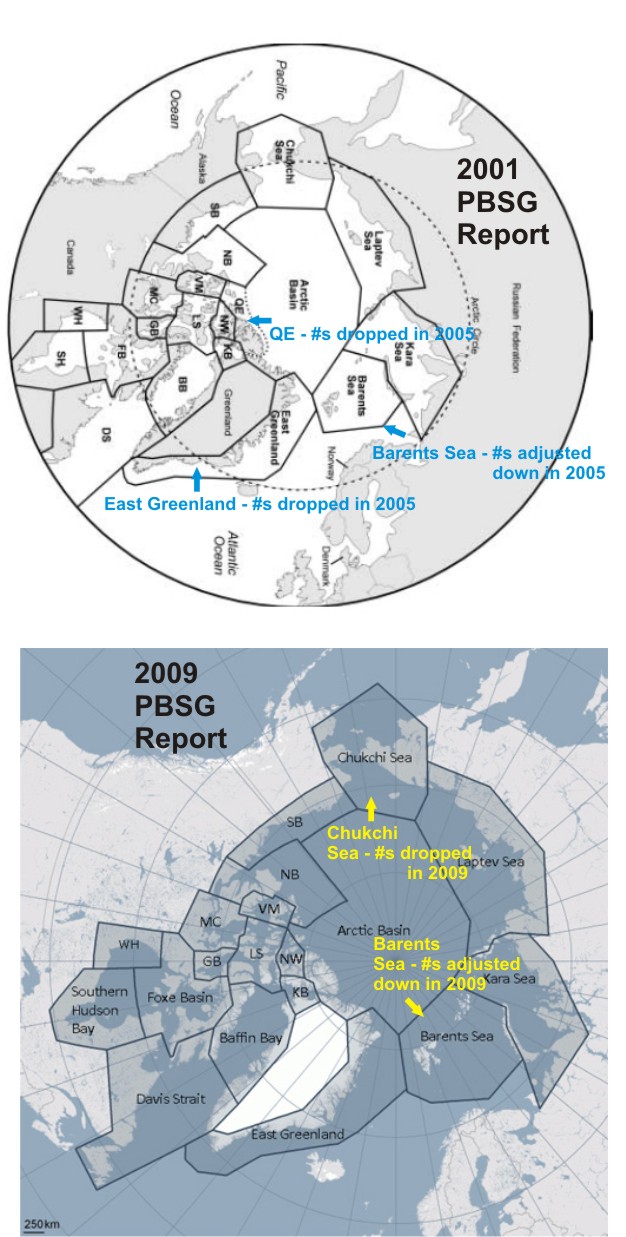
However, some accounting changes were done between 2001 and 2009 (the latest report available) that mean a net increase in numbers had to have taken place (see summary map below and previous post here. Note this is a different issue than the misleading PBSG website graphic discussed here).
And while it is true that population “estimates” are just that — rather broad estimates rather than precise counts — it is also true that nowhere do the PBSG explain how these dropped figures and other adjustments were accounted for in the estimated totals.
The simple details of these changes are laid out below, in as few words as I could manage, to help you understand how this was done and the magnitude of the effect. It’s a short read — see what you think.
UPDATE 15 May 2016: In late November 2015, the IUCN Red List of Threatened Species published a new assessment for polar bears that estimated the global population at 22,000-31,000 and stated the trend was ‘Unknown’. See details here and here – which includes links to the official report and the press release. Sorry for the delay in updating this post.
UPDATE 31 May 2015: See the latest population numbers here.
UPDATE 5 December 2014: Links to more recent posts relevant to this issue added below. [including this one: Status of Canadian polar bear populations has been changed – more good news October 28, 2014
UPDATE February 14, 2014 — a new status table has been released, see new post here
UPDATE February 18, 2014 — see graphs of the 1981-2013 estimates here.
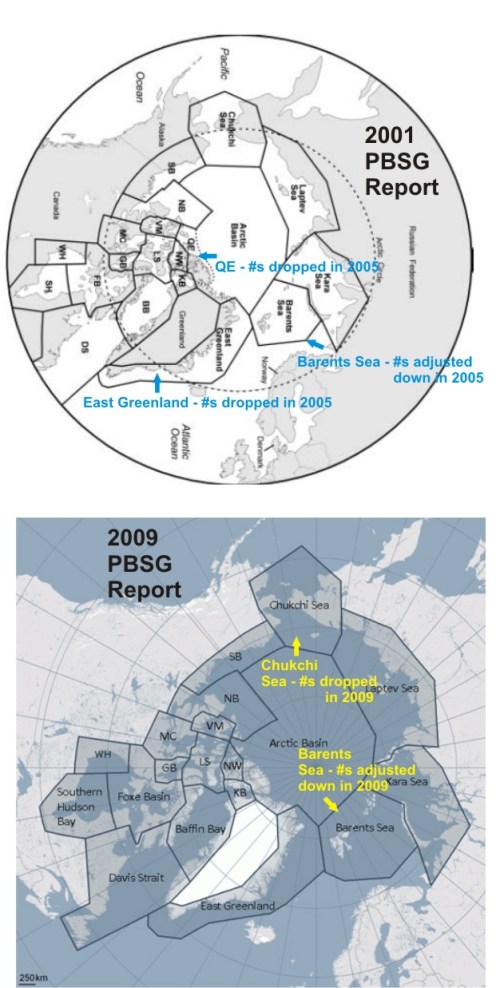
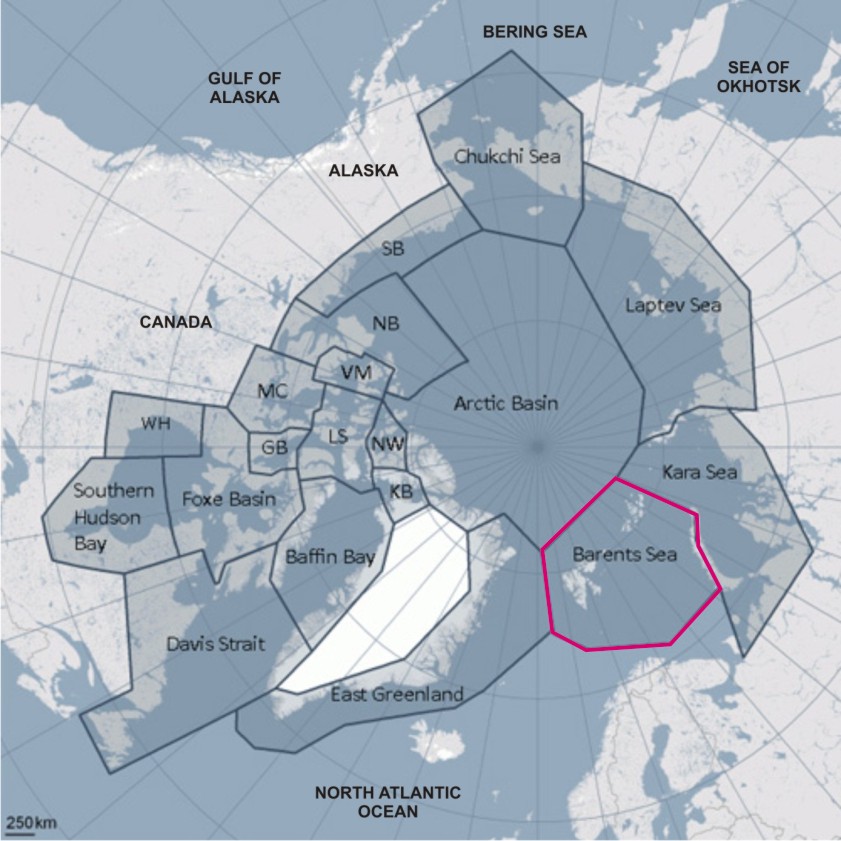
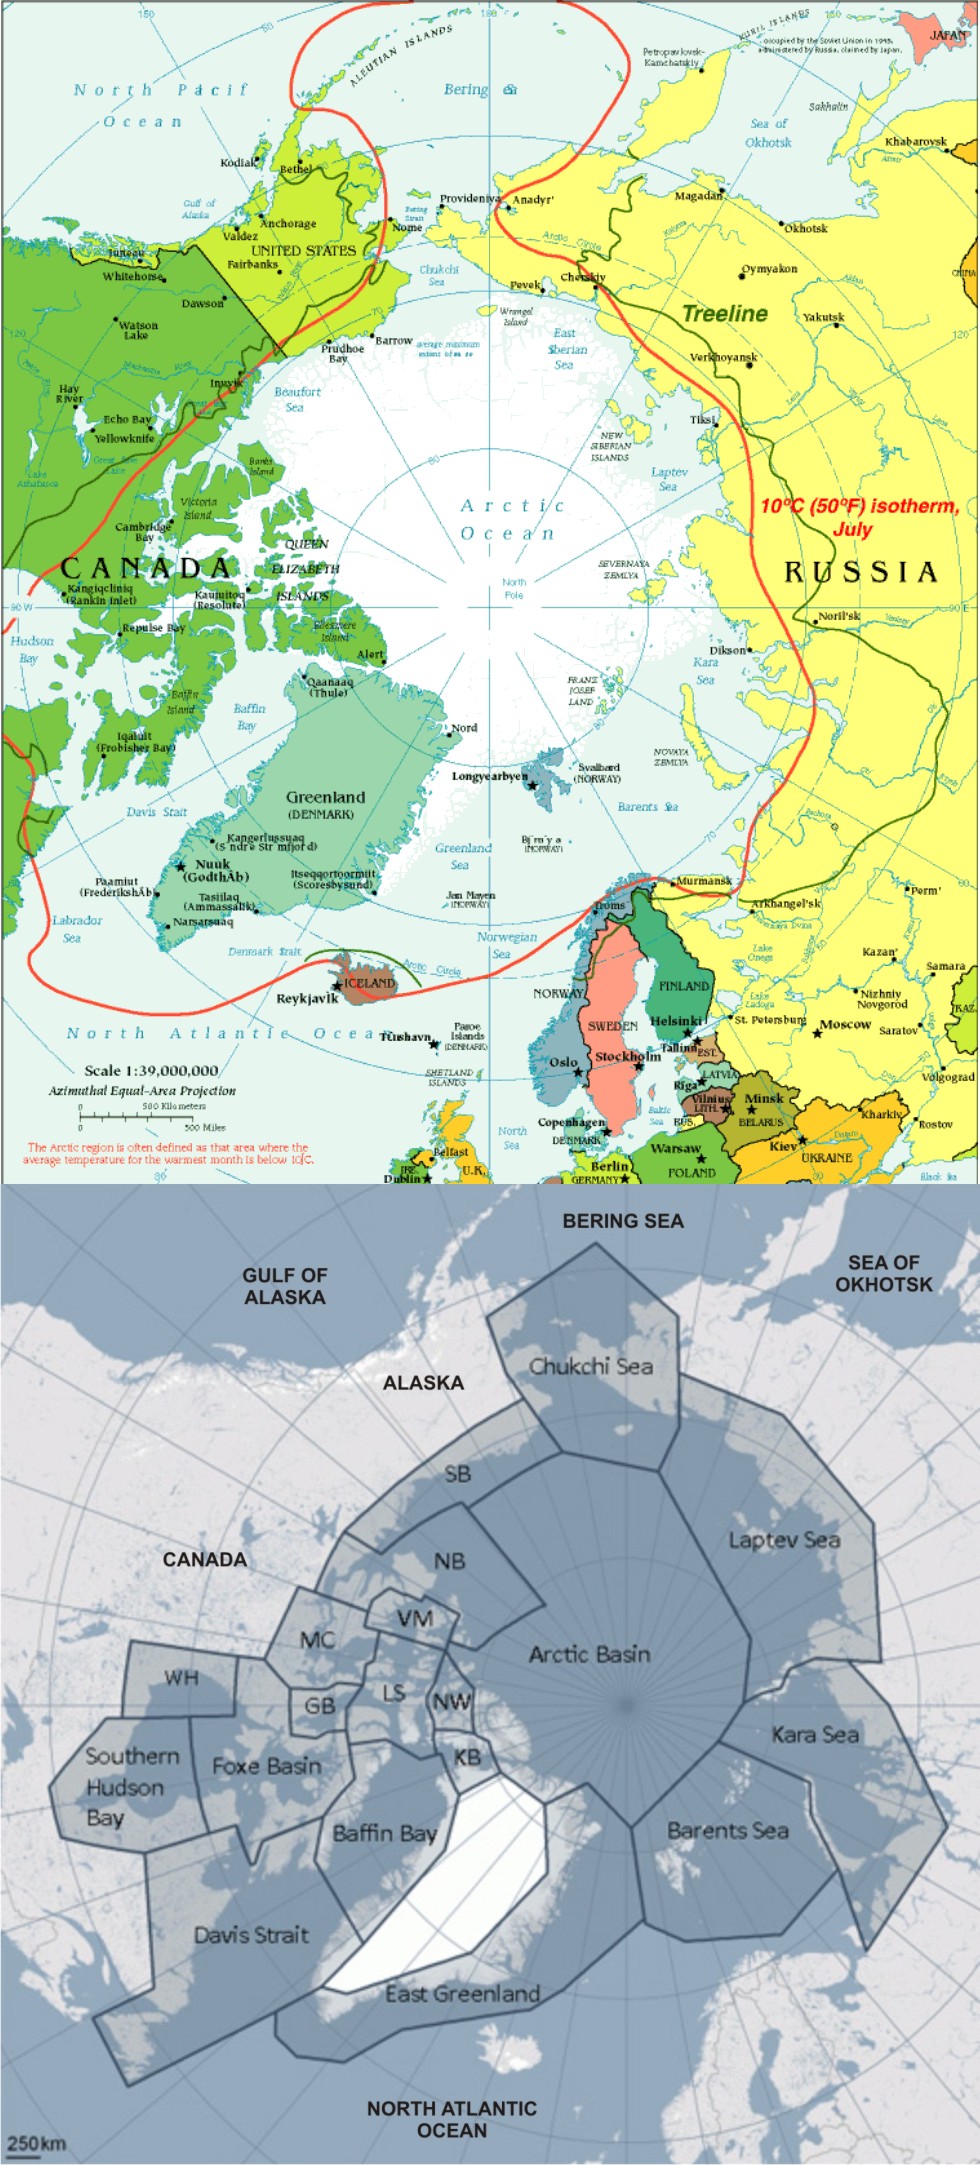
Polar bear subpopulations as defined by the PBSG: Top, in the 2001 report; Bottom, 2009 report. Map courtesy PBSG, with a few labels added and the subpopulations identified where “accounting” changes or adjustments to estimates took place.
SB, Southern Beaufort; NB, Northern Beaufort; VM, Viscount Melville; MC, M’Clintock Channel; LS, Lancaster Sound; GB, Gulf of Boothia; NW, Norwegian Bay; KB, Kane Basin; WH, Western Hudson Bay. Click to enlarge.
Continue reading


You must be logged in to post a comment.