Category Archives: Sea ice habitat

Late winter polar bear habitat 2017 vs. 2006 and 2011 shows no trend

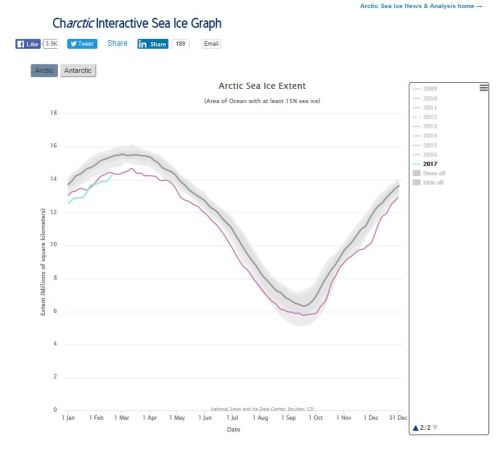
Here is a bit of historical perspective for rational readers trying to make sense of the doom-mongering of others that current sea ice conditions spell trouble for polar bears, given that the winter maximum extent for 2017 reached a new seasonal low (keeping in mind that NSIDC does not publish error bars for these measurements, which helps elevate such pronouncements to “news”).

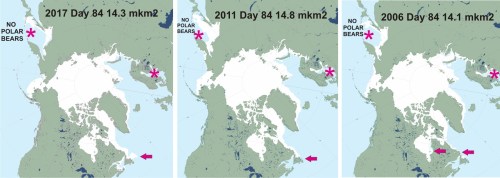
Ice extent (courtesy NSIDC’s MASIE) at 25 March (Day 84) is below for 2017, 2011 and 2006, almost 3 weeks after the winter maximum was declared at 7 March for 2017, 9 March for  2011, and 12 March for 2006. Extent at the maximum for 2006 was estimated at 14.68 mkm2, 14.42 mkm2 for 2017, and 14.67 mkm2 in 2011 (what tiny differences make headlines these days).

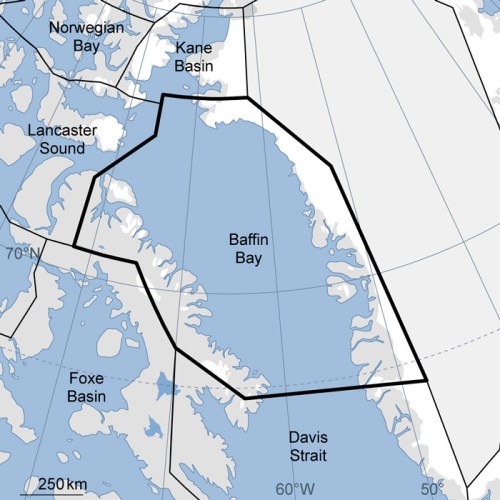
Remember: there are no polar bears in the Sea of Okhotsk or in the Baltic Sea (marked with an * below) yet ice in those regions is included in the Arctic totals used to determine maximum seasonal extent. Much (and sometimes, all) of the “Arctic” variation in extent at this time of year is accounted for by variation in Sea of Okhotsk and Baltic Sea coverage.

Sea ice day 84 March 25 2017_2011_2006 labeled

Bottom line: total winter ice extent for the Arctic ≠ winter polar bear habitat and neither have changed much in a decade.

See close up of the above graphic below.

Continue reading

Another fat bear onshore in late winter, along Gulf of St. Lawrence north coast

Another fat bear onshore in late winter, this time along the Quebec shore of the Gulf of St. Lawrence (22 March 2017) – and this time, one of the witnesses to the sighting took some great photos. Courtesy CBC News (Polar bear makes rare appearance on Quebec’s Lower North Shore 24 March 2017).

Gulf St Lawrence North shore PB visit 22 March 2017_CBC headline

Quotes, location map, and sea ice charts below.

Continue reading

Exposing the failed polar bear scare to a an enthusiastic and influential audience

I’ve just returned from a few days in Washington DC, where I presented the details on the global warming icon that refused to die as modeled (see my slide #12 below) to an enthusiastic and influential audience at The Heartland Institute‘s 12th International Climate Change Conference (ICCC-12).

Crockford 2017_Slide 12 screencap

Polar bear science got some long overdue scrutiny by a large number of people at this meeting. Not unexpectedly, a good many folks were surprised and outraged to learn how the polar bear/sea ice situation has actually unfolded compared to the predicted outcome and on-going media hype.

Continue reading

Several fat polar bears sighted in southern Labrador early this week

Seven polar bears came ashore this week, either passing through or exploring, in Black Tickle, Labrador. It’s not that unusual an occurrence but the take home quote sure is:

“They look really healthy … they have been eating good, these ones have.”

Lucky for them – residents in my novel – EATEN – were not so lucky.

Black Tickle polar bear visits 7 March 2017_CBC news 8 March

A bear onshore along eastern Hudson Bay late last month was also described as fat.

Quotes from the CBC News report (8 March 2017: “7 polar bears visit stormbound Black Tickle“) below.

Black-tickle-map-Labrador 2016

Continue reading

Science behind the video Polar Bear Scare Unmasked – updated paper now available

Announcing the publication today of Version 3 2 of my paper that tests the hypothesis that polar bear population declines result from rapid declines in summer sea ice, updated with recently available data. Version 2 provides the scientific support for the information presented in the GWPF video published yesterday, “Polar Bear Scare Unmasked: The Sage of a Toppled Global Warming Icon” (copied below).

Crockford 2017 V3 title page graphic 3

[The graphic above was created by me from the title page and two figures from the paper]

Updated 1 March 2017: I added an important reference to the paper below that got overlooked in previous versions (the work of Armstrong et al. 2008, see this post), making Version 3 the latest and most up-to-date.

Crockford, S.J. 2017 V3. Testing the hypothesis that routine sea ice coverage of 3-5 mkm2 results in a greater than 30% decline in population size of polar bears (Ursus maritimus). PeerJ Preprints 2 March 2017. Doi: 10.7287/peerj.preprints.2737v3 Open access. https://doi.org/10.7287/peerj.preprints.2737v3

Version 3, published 2 March 2017, adds an important reference; Version 2, published 28 February, incorporates additional reviewer comments and suggestions received on Version 1, as well as the updates noted above.

Continue reading

Polar Bear Scare Unmasked: The Saga of a Toppled Global Warming Icon [video]

For more than ten years, we’ve endured the shrill media headlines, the hyperbole from conservation organizations, and the simplistic platitudes from scientists as summer sea ice declined dramatically while polar bear numbers rose.

Now, just in time for International Polar Bear Day, there’s a video that deconstructs the scare. It runs about 8 minutes, written and narrated by me, produced by the Global Warming Policy Foundation.

Polar Bear Scare Unmasked: The Saga of a Toppled Global Warming Icon

Update 28 February 2017 See my follow-up post for the science behind the video, featuring a new version of my sea ice/polar bear hypothesis paper, just published (and updated with new data).

Crockford, S.J. 2017 V3. Testing the hypothesis that routine sea ice coverage of 3-5 mkm2 results in a greater than 30% decline in population size of polar bears (Ursus maritimus). PeerJ Preprints 2 March 2017. Doi: 10.7287/peerj.preprints.2737v3 Open access. https://doi.org/10.7287/peerj.preprints.2737v3

Thriving numbers – & two great books – are ample reason to rejoice on Polar Bear Day

Ten years of summer sea ice levels expected to kill 2/3 of the world’s polar bears by 2050 instead saw polar bear numbers grow. And this year, there are also two fabulous books about polar bears and their outstanding success story to celebrate on International Polar Bear Day (Monday 27 February 2017).

os-and-fm-cover-drafts-14-dec-2016

One is suitable for kids (Polar Bear Facts & Myths) and another for adults and teens who want the details (Polar Bears: Outstanding Survivors of Climate Change) – see the right sidebar to buy on Amazon or my author website for details on all additional formats. A couple of excerpts from them are below.

So forget turning down your thermostat in a pointless gesture to “reduce your carbon emissions and help polar bears” — as Polar Bears International advocates for Polar Bear Day. Instead, treat yourself or a friend and order a book with a rational approach to species survival.

Speaking of species survival, think about the inconsistency in how some species are treated according to the US Endangered Species Act (ESA). Humpback whale numbers recovered after decades of protection; in 2016, after the state of Alaska filed a petition to delist, most populations were officially removed from the ESA list of ‘threatened’ species.

humpback-whale-and-calf-012016-noaa

Humpback whale and calf, NOAA image.

In contrast, by 2015, polar bear numbers had also recovered despite years of low sea ice loss not predicted until 2050, yet remain officially ‘threatened’ with extinction.

polar_bear_family_at_bone_pile-kaktovik-20-april-2016

Fat bear family at Kaktovik, Alaska (Southern Beaufort), April 2016. USGS photo.

US National Marine Fisheries Service defended the delisting of humpback whales against activists who insisted human-caused global warming threatened the species, but the US Fish and Wildlife Service defends flawed polar bear prophesies.

My books lay out the polar bear success story: in simple form for younger readers and in detail for others. See the excerpts below.

crockford-pb-outstanding-survivors-2017_end-of-pg-30

Polar bears have not been driven to the brink of extinction by global warming. In fact, they are thriving (see my final conclusions on pg. 30 of Polar Bears: Outstanding Survivors of Climate Change, above and pg. 32 of Polar Bear Facts & Myths below.

crockford-pb-facts-and-myths-2017-pg-32

If you’d like to support my efforts to bring this to everyone’s attention, please consider buying a copy or two of my books. If you’ve already done so, keep in mind that your local library might be glad to have copies donated. They also make great gifts.

Save

Save

Global polar bear population larger than previous thought – almost 30,000

The results of three recently-released studies that were not included in the last IUCN Red List assessment add more than 2,050 bears (on average)1 to the official 2015 global polar bear estimate, a point you won’t likely hear next Monday (27 February) from most polar bear specialists, conservation organizations, their cheerleaders and corporate sponsors on International Polar Bear Day.

global-pb-population-size-graphic2_2017-feb-polarbearscience-corrected

This means the adjusted 2015 global estimate for polar bears should be about 28,500 (average), a marked increase over the official estimate of 26,500 (average) for 2015 — and an even larger increase over the 2005 estimate of about 22,500 (average)2, despite the dramatic loss of summer sea ice since 2007 that we hear about endlessly.

It is increasingly obvious that polar bears are thriving despite having lived through summer sea ice levels not predicted to occur until 2050 – levels of sea ice that experts said would wipe out 2/3 of the world’s polar bears (Amstrup et al. 2007; Crockford 2017 v3).

Update 26 March 2019: see “Latest global polar bear abundance ‘best guess’ estimate is 39,000 (26,000-58,000)

Updated 1 June 2017:  see addition to Footnote 2.
Continue reading

Polar bear habitat update: Masie charts show more ice in 2017 than 2006

It’s just an observation but NSIDC Masie ice charts show 14.7 mkm2 of sea ice for 2017 at 19 February (Day 50) but only 14.3 mkm2 for 2006 (see them copied below).

In contrast, the NSIDC interactive graph shows almost the opposite: 14.3 mkm2 for 2017 and 14.4 mkm2 for 2006 (but with both below 2 standard deviations of average).

sea-ice-at-19-feb-2017_vs-2006_nsidc-interactive

Continue reading

Baffin Bay and Kane Basin polar bears not ‘declining’ concludes new report

The 2016 Scientific Working Group report on Baffin Bay and Kane Basin polar bears was released online without fanfare last week, confirming what local Inuit have been saying for years: contrary to the assertions of Polar Bear Specialist Group scientists, Baffin Bay and Kane Basin subpopulations have not been declining but are stable.

polar-bear-feeding_shutterstock_sm

Until recently, the Baffin Bay (BB) and Kane Basin (KB) polar bear subpopulations, that live between NW Greenland, and Baffin and Ellesmere Islands, were assessed with confidence by the IUCN Polar Bear Specialist Group (PBSG) to be declining due to suspected over-hunting (see 2016 Report, Ch. 1, pg. 4).

It turns out they were wrong.

map-baffinbay

New (2016) polar bear subpopulation estimates for BB and KB:

Baffin Bay 2,826 (95% CI = 2,059-3,593) at 2013

                  [vs. 1546 (95% CI = 690-2,402) expected 2004]

                  vs. 2,074 (95% CI = 1,553-2,595) in 1997

  Kane Basin357 (95% CI: 221 – 493) at 2013

                    vs. 164 (95% CI: 94 – 234) in 1997

[1997 figures from 2015 IUCN Red List estimates, from Supplement, pg. 8); 2004 “expected” figure for Baffin Bay from 2016 SWG report, Ch. 1, pg. 4]

In 2014, Environment Canada’s assessments were ‘data deficient’ for Kane Basin and ‘likely declining’ for Baffin Bay (see map below):
ec_polarbearstatus_and-trends-lg_2010-2014-mapscanada_oct-26-2014

However, the results of this new study (conducted 2011-2013) would likely make KB in the map above dark blue (‘stable’), and BB light blue (‘likely stable’), depending on how the new information is interpreted (given differences in methodology between the 1991-1997 and 2011-2013 counts). Note that a recent paper by Jordan York, Mitch Taylor and others (York et al. 2016) suggested this outcome for Baffin Bay was likely (i.e. ‘stable’) but thought that the status of Kane Basin would remain ‘declining.’

This new information leaves only the Southern Beaufort subpopulation (SB) in a ‘likely declining’ condition, but since that decline was due to thick spring ice conditions in 2004-2006 (Crockford 2017), it does not reflect a response to recent loss of summer sea ice. The new population estimates for Baffin Bay and Kane Basin also suggests that a revision needs to be made to the 2015 IUCN Red List assessment with respect to the global population estimate because polar bears are clearly more abundant in Baffin Bay and Kane Basin than previously thought.

Continue reading