Tag Archives: habitat

Tracking polar bears in the Southern Beaufort, with a sea ice surprise – April 2015 map

USGS biologists were clearly busy this spring putting more satellite radio collars and glue-on tags on Southern Beaufort Sea polar bears but there’s some surprising information in their April 2015 tracking map about current sea ice conditions.

From the 2013-2014 issue of  “Polar Bear News” (USFWS).

From the 2013-2014 issue of “Polar Bear News” (USFWS).

What’s interesting is that the sea ice maps they use show less dark spots that might be open water this year than were present last year in late April. Oddly, this phenomenon has one prominent biologist worried about “challenging” polar bear habitat developing this year – without mentioning last year at all.

The USGS track map for April 2015 is copied below.1
Continue reading

Polar bear habitat update: highly concentrated ice in eastern Hudson Bay this spring

Sea ice in eastern Hudson Bay (bright white in the map below) is more concentrated than at this time last year and similar to the ice found in the Central Canadian Arctic.

Sea ice extent Canada 2015 April 11 CIS

There is more concentrated ice (10/10 concentration) in the east side of the Bay than there was in 1992, a heavy ice year blamed in part on the eruption of Mt. Pinatubo (Chambellant et al. 2012) that resulted in the latest breakup date for Western Hudson Bay since 1991.

Continue reading

Arctic sea ice extent total for March does not equal global polar bear habitat

Only half or less of the estimated 2.6% loss per decade of March sea ice extent since 1979 (Fig. 1, below) represents a decline in polar habitat. That’s because several regions with sea ice that are not home to polar bears, like the Sea of Okhotsk, are included in Arctic sea ice totals.

Figure 1. Average monthly Arctic sea ice extent for March 1979-2015, which includes ice in the Sea of Okhotsk and the Sea of Japan, a decline of 2.6% per decade. NSIDC, March summary 2015.

Figure 1. Average monthly Arctic sea ice extent for March 1979-2015 (which includes ice in the Sea of Okhotsk, the Sea of Japan, and the Baltic, where polar bears do not live), shows a decline of 2.6% per decade. NSIDC, March summary 2015.

Both the Sea of Okhotsk and northern Sea of Japan (Fig. 2) have sea ice in winter (which is included in total Arctic sea ice records) but they are not truly “Arctic” – neither is connected to the Arctic by continuous ice, even when the ice is at its maximum extent (nor is the Baltic Sea — in contrast to Hudson Bay and the east coast of North America, which are connected to the Arctic by continuous ice).

Sea of Okhotsk_1979 March marked_PolarBearScience

Figure 2. Location of the Sea of Okhotsk and Sea of Japan. Insert ice map for March 1979 from NSIDC shows it’s position relative to the Arctic proper.

That lack of connection to Arctic pack ice is probably the main reason that polar bears never colonized the Sea of Okhotsk, even though western Arctic seal species (ringed, bearded, spotted, and ribbon) and Arctic whales  (bowhead and beluga) live there. Polar bears don’t currently live in the Sea of Okhotsk and all evidence suggests they never have.

Sea ice maps show that about half of the total ice extent difference between March 1979 and March 2015 was due to a relatively large decline in sea ice cover for Sea of Okhotsk and northern Sea of Japan — regions without polar bears. Surely no reputable scientist or journalist would suggest that the “record low” maximum ice extent for 2015 has any relevance for polar bear health and survival? [or for Northwest Passage travel, for that matter] Sadly, they would.

Continue reading

Superb sea ice conditions for polar bears worldwide during their critical feeding period

Prognosis, excellent. The sea ice hunting platform that polar bears require is everywhere and Davis Strait ice extent is the fourth-highest it’s ever been at this time of year.

Sea ice extent global 2015 April 2 NSIDC with anomaly WUWT

The spring feeding period is a messy, brutal business – many cute baby seals will die as polar bears consume 2/3rds of their yearly food supply over the next few months (April – June/early July), while sea ice is abundant.

Arctic marine mammals_Dec 31 2014_Polarbearscience

That leaves the remaining 1/3 of their energetic needs to be met over the following 9 months (most of it in late fall (late November/December) and hardly any during the summer months, regardless of whether the bears are on land or out on the sea ice) or over the winter. Continue reading

Polar bear consumption of terrestrial foods – new paper misses the point

A new paper by polar bear biologists (Rode et al. 2015) argues that terrestrial (land-based) foods are not important to polar bears now and will not be in the future – a conclusion I totally agree with – but they miss the point entirely regarding the importance of this issue.

Fat bears on land in the Southern Beaufort, Sue Miller photo, well-prepared for a brief summer fast.

Whatever food polar bears consume in the summer – whether they are on land or on the ice – doesn’t really matter. What matters is how many fat-rich seals they can consume between March and June each year. The fat put on in late winter/spring from gorging on baby seals carries polar bears over the summer, no matter where they spend it.

USGS polar bear biologist Karyn Rode and colleagues (press release here) have tried to frame this issue as one about future survival of polar bears in the face of declining sea ice. However, the fact that polar bears in the Chukchi Sea and Southern Davis Strait are thriving despite dramatic declines in summer sea ice (aka an extended open-water season), proves my point and disproves their premise. Bears in these regions are doing extremely well – contrary to all predictions – because they have had abundant baby seals to eat during the spring (see here and here).

Continue reading

Davis Strait polar bear habitat – the sea ice is forming, but it’s late!

Since 1971, there have been only two years with as little sea ice in Davis Strait as there was this year at this time – 2003 and 2010. But the ice is forming rapidly and history shows it will likely catch up enough by next week to allow most Davis Strait polar bears to start hunting seals except along the Labrador coast.

Courtesy IUCN PBSG

Courtesy IUCN PBSG

Have a look at the ice maps and charts below from the Canadian Ice Service for the status of freeze-up in Davis Strait.

UPDATE 30 November 2014: Sea ice extent map from NSIDC added.

Continue reading

Polar bear habitat update: what a difference a year makes to sea ice coverage in Canada!

There is far more ice — and far more concentrated ice — in Canada this year than on this day last year. That’s good news for most polar bear populations.

[And, it turns out, more ice total this year on this date than there has been since 2001!]

Polar bears off Churchill_2000-11-20_wikipedia

I’ve made a composite 2014/2013 ice map for 4 November that tells the story (courtesy daily Canadian Ice Service sea ice maps).
Continue reading

Polar bear habitat update – January 2014

Sea ice in the Arctic a bit below the 1981-2010 average for this date  but still within two standard deviations, with more ice than average off Canada — indicating we are still within expected natural variation, statistically speaking.

Remember that the National Snow and Ice Data Center (NSIDC) says this about standard deviation:

“Measurements that fall far outside of the two standard deviation range or consistently fall outside that range suggest that something unusual is occurring that can’t be explained by normal processes.”

Ice maps below, click to enlarge.

 Figure 1. Sea ice and lake ice concentration from the Canadian Ice Service (CIS) for 31 January, 2014. Note the amount of ice in the east, off Labrador (the “Davis Strait” polar bear subpopulation).


Figure 1. Sea ice and lake ice concentration from the Canadian Ice Service (CIS) for 31 January, 2014. Note the amount of ice in the east, off Labrador (the “Davis Strait” polar bear subpopulation).

Figure 2. Sea ice extent from the National Snow and Ice Data Center (NSIDC) for 29 January 2014. Note that the extent of ice in eastern Canada noted in Fig. 1 is slightly more than the 1981-2010 average (the orange line), while other areas have slightly less than average for this date. Compare ice growth over the last month to Fig. 3 below.

Figure 2. Sea ice extent from the National Snow and Ice Data Center (NSIDC) for 29 January 2014. Note that the extent of ice in eastern Canada noted in Fig. 1 is slightly more than the 1981-2010 average (the orange line), while other areas have slightly less than average for this date. Compare ice growth over the last month to Fig. 3 below.

Continue reading

Tracking polar bears in the Beaufort Sea: September map

Here is the follow-up to my post on the July track map for polar bears being followed by satellite in the Beaufort Sea by the US Geological Survey (USGS) – Ten out of ten polar bears being tracked this summer in the Beaufort Sea are on the ice. See that post for methods and other background on this topic, and some track maps from 2012 (also available at the USGS website here).

The track map for September was posted on the USGS website on October 17 (delayed due to the US government shutdown) and is copied here below (Figure 1). The ice rebounded during the second half of the month (after the annual minimum was reached on September 13). The ten bears from July were down to eight – their collars might have stopped working or fallen off (most likely), they might have left the area entirely (also possible) or they might have died (the researchers don’t say which).

Figure 1. “Movements of 8 satellite-tagged polar bears for the month of September, 2013. Polar bears were tagged in 2013 on the spring-time sea ice of the southern Beaufort Sea. All 8 of these bears have satellite collar transmitters [i.e., all are females]. Polar bear satellite telemetry data are shown with Ice Analysis charts from 26 August, 2013. Ice Analysis charts are made available by the National Ice Center. The land cover is made available by Natural Earth. Click on the above image to enlarge.” [Note that the dots with the polar bear icons are the end points (end September), while the other end of the string is their position in early September, indicating that the ice is now moving towards the shore. The pink dot present in August is almost entirely obscured by the purple dot, on shore in Alaska and the light brown dot is ashore on Banks Island, centre right of the map; two of the bears present in July (see Fig. 2 below) are no longer being tracked - their collars might have stopped working or fallen off (most likely), they might have left the area entirely (also possible) or they might have died. The researchers don’t say.] Click to enlarge

Figure 1. Original caption: “Movements of 8 satellite-tagged polar bears for the month of September, 2013. Polar bears were tagged in 2013 on the spring-time sea ice of the southern Beaufort Sea. All 8 of these bears have satellite collar transmitters [i.e., all are females]. Polar bear satellite telemetry data are shown with Ice Analysis charts from 26 August, 2013. Ice Analysis charts are made available by the National Ice Center. The land cover is made available by Natural Earth. Click on the above image to enlarge.” [Note that the dots with the polar bear icons are the end points (end September), while the other end of the string is their position in early September, indicating that the ice is now moving towards the shore. The pink dot present in August is almost entirely obscured by the purple dot, which is overlapping the yellow dot on shore in Alaska; also, the light brown dot is on Banks Island, far right.]

It appears that of the eight polar bears still being followed by USGS researchers in September, four are on shore and four are still on the ice. Only time will tell if the four females on shore are pregnant and preparing maternity dens for the winter, but this seems the likely reason they are not on the ice with the others.

One very interesting point worth noting:
the one bear (light brown) captured onshore in the Southern Beaufort subpopulation region in the spring of 2013, has moved into the Northern Beaufort subpopulation region, on Banks Island (see map here), and may be denning there. This inter-subpopulation movement is relatively uncommon.

The map for July 2013 is below, for comparison: Continue reading

Polar bears of W. Hudson Bay came ashore in 2009 as late as in 1992

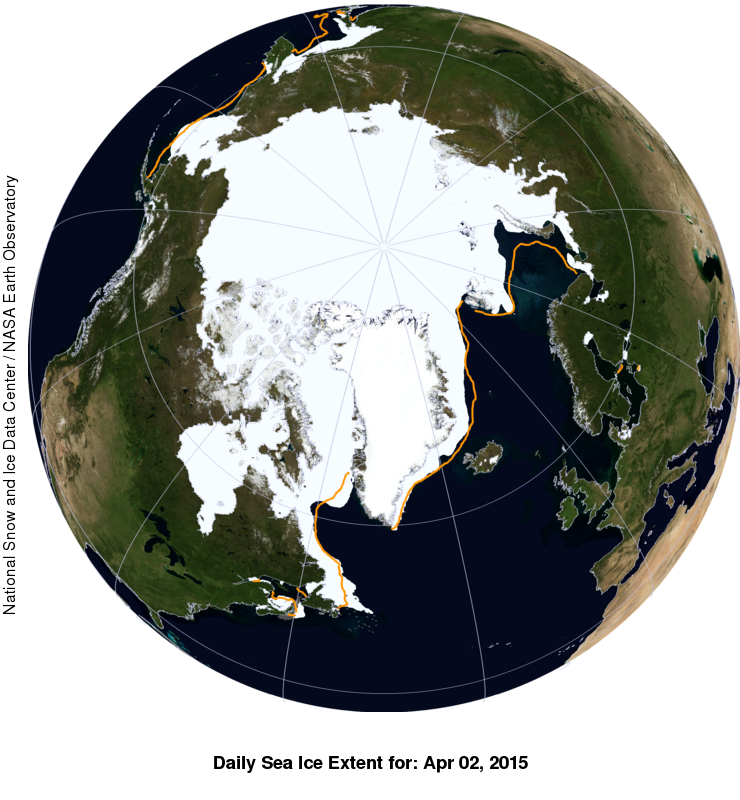
It’s like pulling teeth, getting up-to-date information on breakup dates of Hudson Bay sea ice. You’d think with the importance of this seasonal event to the polar bears of Hudson Bay (some of which, we’re told, face the most perilous future of all polar bears worldwide), we’d get a press release every summer alerting us to the precise date of sea ice breakup and the subsequent arrival of the bears onshore. I’m thinking of something similar to the dispatches we get from the National Snow and Ice Data Center (NSIDC) when Arctic sea ice reaches its yearly maximum (e.g. March 2012) and its yearly minimum extent (e.g. September 2012).

Sadly, this is not the case.

So I was intrigued to see that a new paper just out in the Journal of Animal Ecology, by Seth Cherry (a Ph.D. student of Andrew Derocher) and colleagues, dealt with Hudson Bay breakup dates. I was hoping for some data beyond 2007, which has been the limit of information provided so far by polar bear biologists (see previous posts here and here). Unfortunately, because the methods for determining breakup dates in this paper are so different from previous ones (more detail below), the new data (1991-2009) can’t be compared to earlier studies that go back to 1979. But there is some good news.

Although you wouldn’t know it by the author’s conclusion, the results of the study confirm for this region my previously stated contention that polar bears need spring and early summer ice (March through June) for gorging on young, fat seals and documented declines in sea ice have rarely impinged on that critical feeding period – by which I meant, bears have seldom, if ever, been forced off the ice of Hudson Bay as early as June.

The study also confirms that there has not been any kind of spectacular retreat of sea ice breakup dates – coming earlier and earlier in the season – over the last 19 years and that polar bears did not arrive on shore in 2009 until very late – approximately 22 August – the same date they came ashore in 1992.

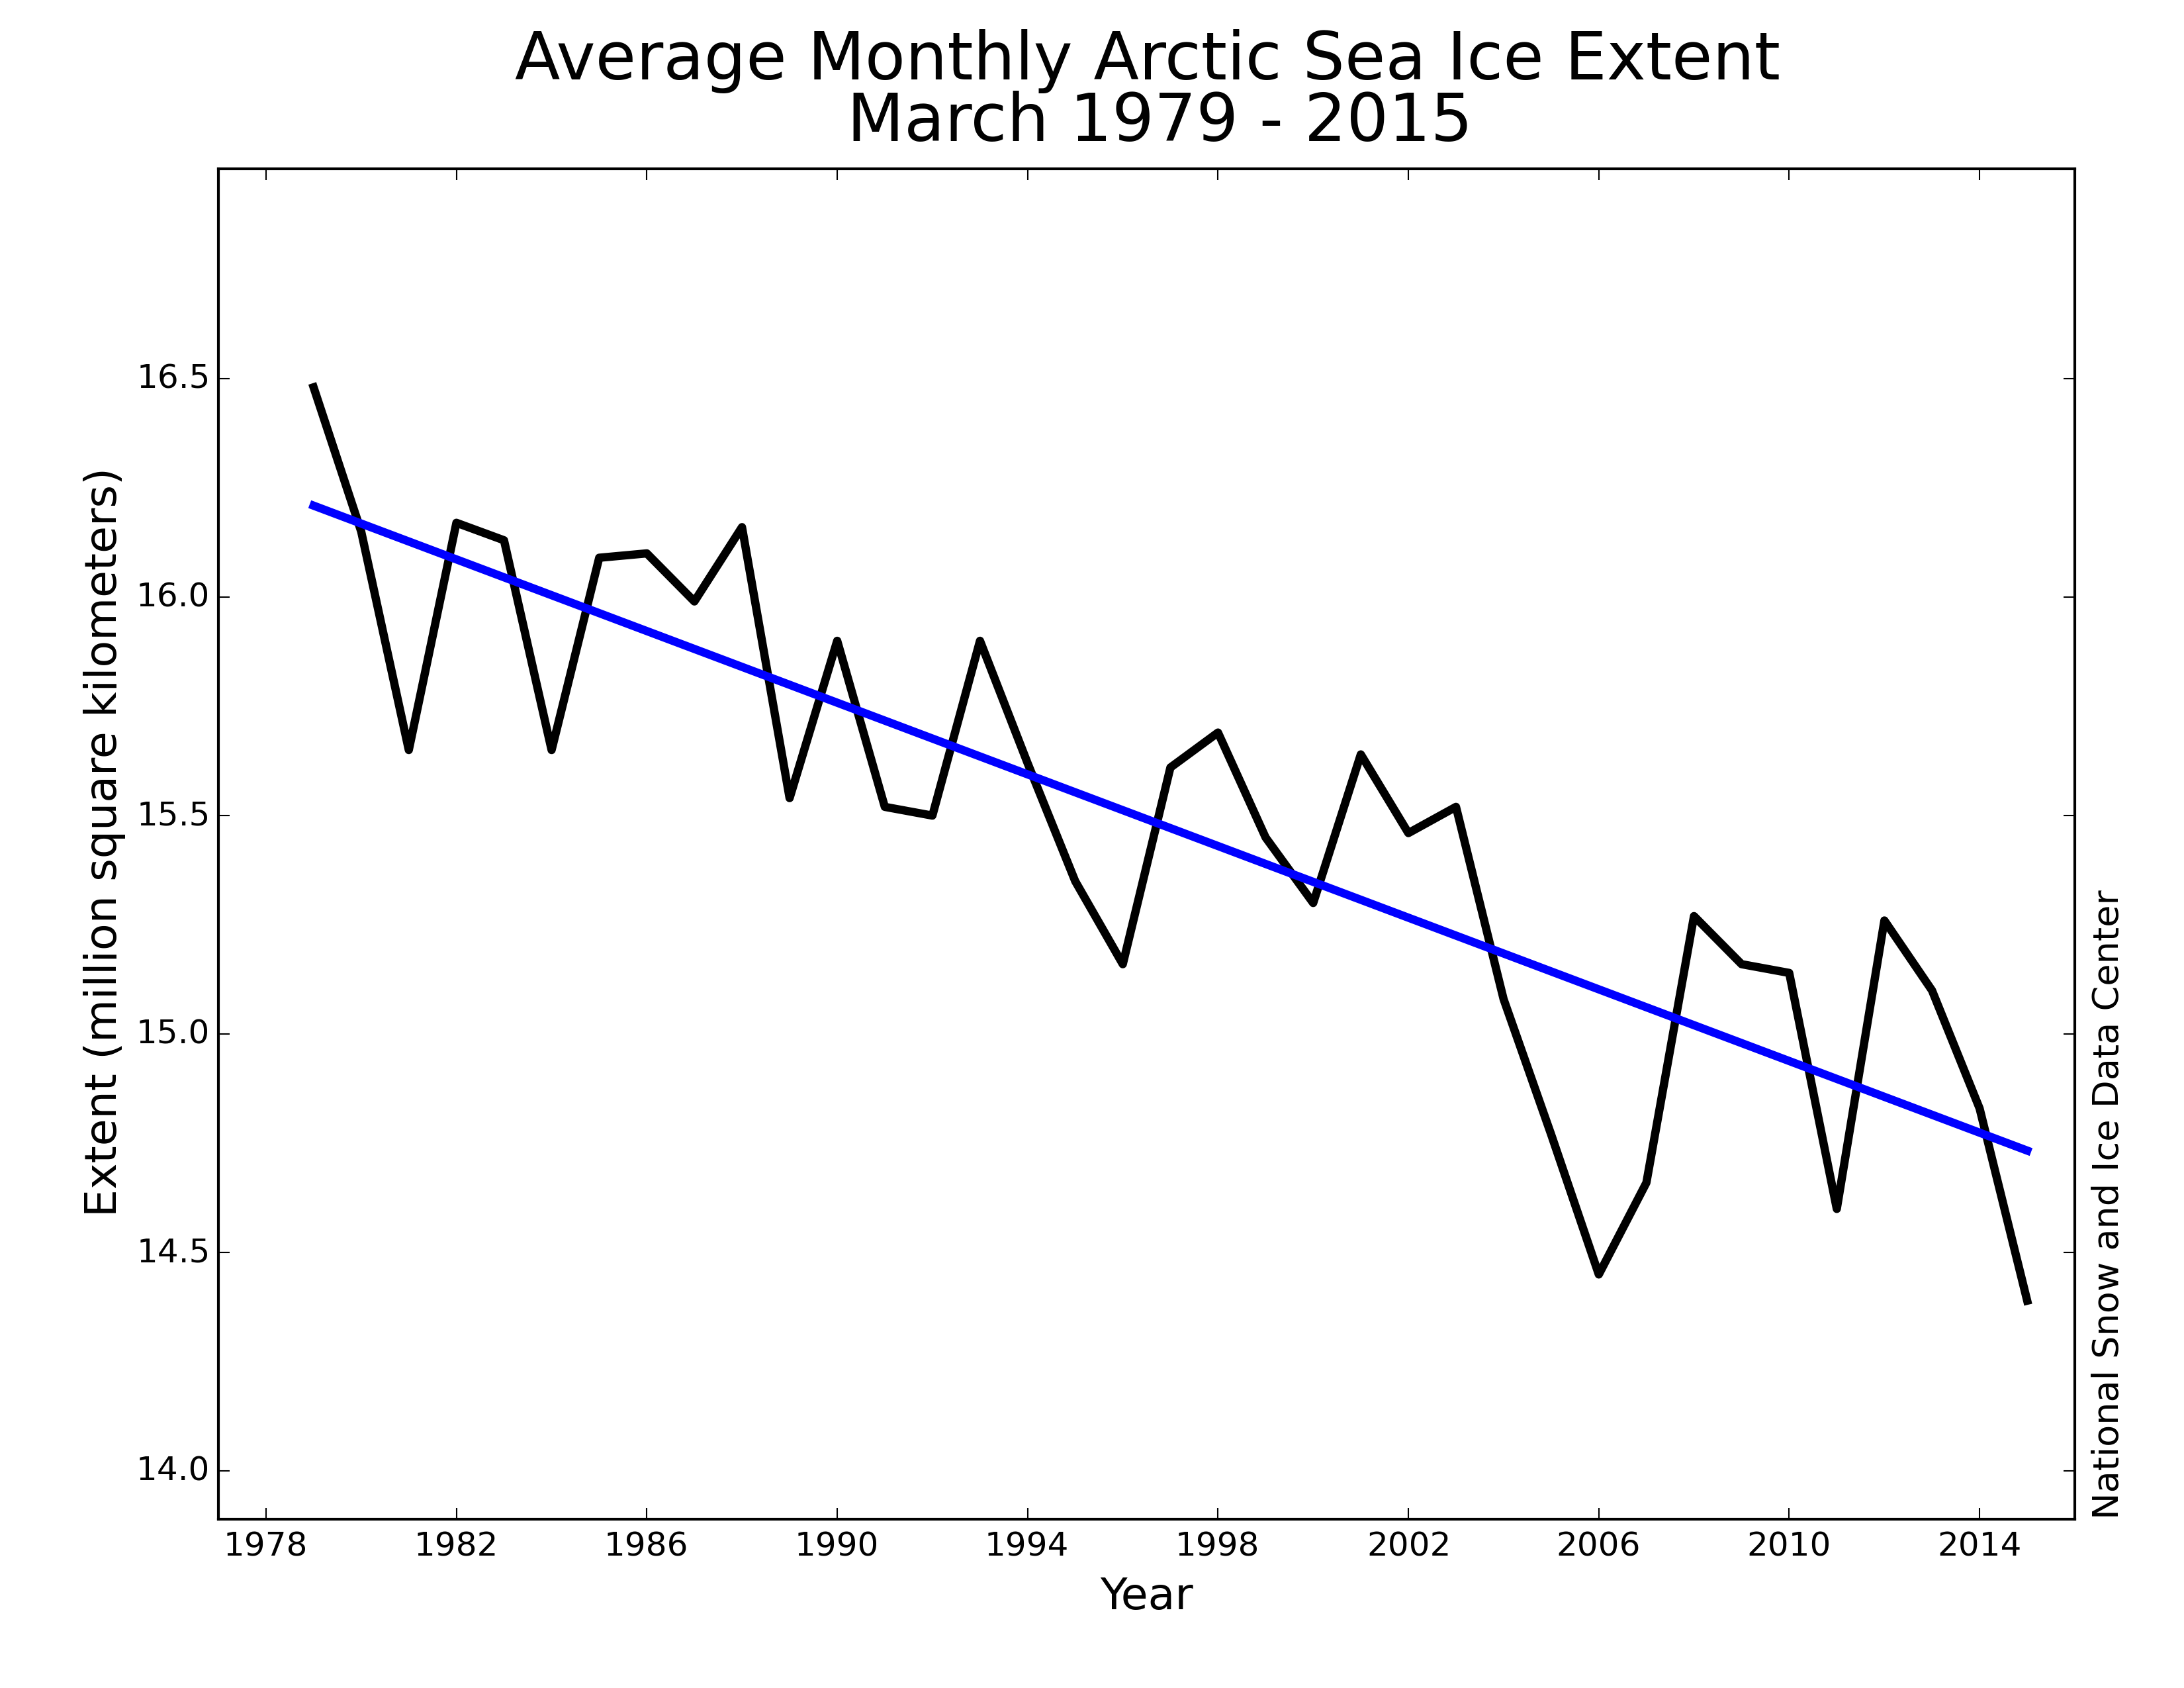
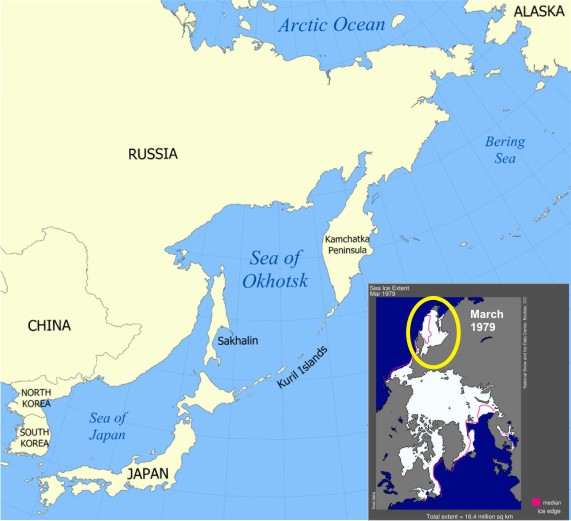
Below are two figures from the paper: one (the map) necessary to understand the new “Cherry method” of calculating breakup dates for Hudson Bay (no disrespect intended) and the other (the graph), which presents the data collected. The table with my converted breakup dates is below them. A few quotes from the study and some comments on it follows.

UPDATE (March 21 2013; 6:12 PM PST). A typo in the table has been fixed (2001 is Jun 21 not Jul 21) and the post amended accordingly.
UPDATE 2 (July 7, 2013) The Cherry et al. paper is now in print, the references have been updated accordingly.

Continue reading