Tag Archives: western hudson bay

No correlation between freeze-up dates for WHB sea ice & Churchill temperatures

This is a follow-up to my last post and this time, I’ll address the implied correlation between freeze-up dates for Hudson Bay and Churchill temperatures in November that is being made by folks who should know better .

polar-bear-tests-thin-ice_mario-hoppmann_noaa-funded-imaggeo-egu-eu

Monday, 14 November 2016 a.m, over at Polar Bears International [my bold]:

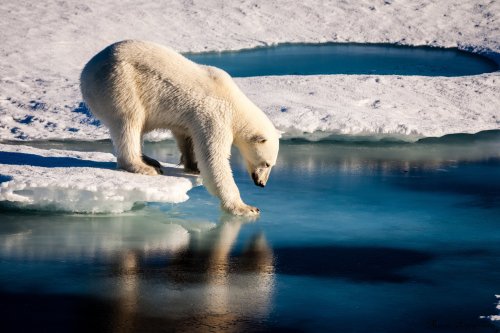
“As a new week starts in Churchill, the weather is the warmest we’ve ever seen at this time of year. The tundra is muddy, with remnant patches of snow, and the bay is ice-free.” PBI Blog (no author designated)

Well, that may be true for the last few years – the high on 14 November 2016 (-1.20C) was the highest since 2012.

Andrew Derocher made a similar statement on the 4th (my bold):
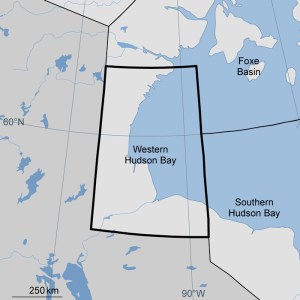
There’s no sea ice anywhere in Hudson Bay yet—not even in the northern part of the Bay where ice should be forming. It’s above freezing today and if the forecast holds, it will be a record high for this date. It was 10 degrees colder last year at this time.”

Derocher is being unscientifically vague here and also misleadingly cites highs and lows as if they were the same. In fact, according to weather records kept by Environment Canada, for 4 November 2016 at Churchill, the daily high was +1.50C (compared to –1.50C in 2015). The daily low in 2015 was -15.30C, a 10 degree difference. The next-highest temp. for that date since 2012 was +0.70C in 2014 – hardly an earth-shattering difference.

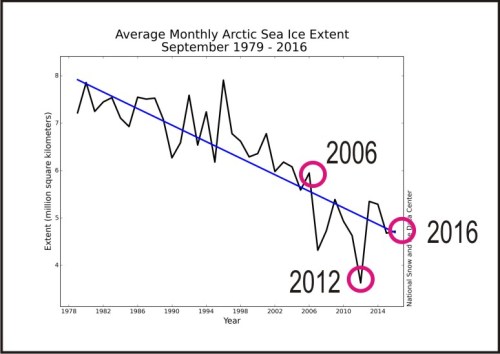
However, if you are trying to draw conclusions about climate, you should go back at least 60 years (two climate periods of 30 years each). Temperature records for Churchill go back to 1943, which can be used to assess the claim for the 14th of November made by PBI.

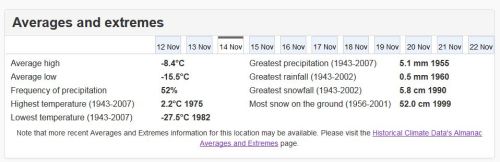
According to weather records kept by Environment Canada, for 14 November at Churchill, the year with the highest temperature was 1975 (+2.20C):

churchill-weather-averages-and-extremes-2016-ec-14-nov

That was Monday. But as of yesterday, the weather recorded – and the forecast for the following week (17-23 November) was quite different, as the screencap below shows:

churchill-weather-2016-abnormal-cold-17-23-nov

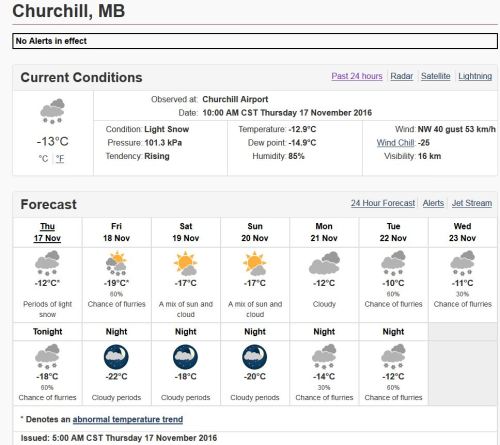
The final recorded max. for yesterday (Thurs. 17 Nov) was -9.70C vs. a min. of -17.70C. So, a bit warmer during the day than predicted but as cold as expected overnight.

And for today, the current temperature in Churchill, as I write this is, is -190C (-310C with the wind chill) and the year with the highest temperature recorded for 18 November was 1944 (0.00C) – which was also the highest temperature for the 19th, recorded in 1943.

Ice maps and historical background below. See last post for recent multi-year comparison.
Continue reading

No correlation between freeze-up dates for Hudson Bay & total Arctic ice cover

Guess which year between 2006 and 2016 had the latest start to freeze-up on Hudson Bay, given that 2012 had the lowest September average and 2007 and 2016 tied for second-lowest (see graph below, from NSIDC), and that sea ice in the Arctic right now is the lowest it’s been for this date since 1979?

sea-ice-sept-averages-graph-only-marked-for-2006-up

If you guessed anything other than 2010, you guessed wrong – in addition, 2006 (not 2016) was second latest.

There is no correlation between Arctic sea ice coverage and freeze-up dates for Western Hudson Bay.

Yet, Polar Bears International (“Save Our Sea Ice”) –  who were surely in and around Churchill in 2010 and 2006 watching polar bears – just posted an alarming statement about local conditions, implying that slow freeze-up of Hudson Bay this year is a reflection of the fact that “sea ice is at a record low across the Arctic.”

They also claim that “…the weather is the warmest we’ve ever seen at this time of year.” That may be true, but if so, it is also meaningless with respect to the progress of freeze-up.

Does no one at PBI remember the very late freeze-up of 2010 or 2006? Odd, that.

Continue reading

Polar bears off the ice in W. Hudson Bay are “well fed and in great shape” this year

Churchill_Polar_Bear_2004-11-15 Wikipedia

Reports from Seal River, just north of Churchill at Churchillwild, at July 26 were crowing about seeing lots of bears onshore, with a veritable beehive of activity the weekend of 16/17 July:

“This has without a doubt been Churchill Wild’s most spectacular start to the summer polar bear watching season. …Bear numbers are up spectacularly this year and all are looking very fat and healthy, perhaps much to the chagrin of climate change “experts.” Our best day for the seductive white carnivores over the past week featured 21 polar bears sighted between the Lodge and our whale swim spot!

The ice pack, which was still visible a week ago [i.e, 17 July or so], has finally dissipated and pushed a large number of bears on to our coastline here at Seal River, with the end result being many very happy cameras!” [my bold]

And in Churchill proper, the Polar Bear Alert program has issued three reports so far this season (courtesy the Town of Churchill), which confirm that bears in the Polar Bear Capital of the World are also in great shape.

For the week of July 11-17, 2016:

“Bears are off the sea ice and on land. They are looking well fed and in great shape.”

See all three PBA reports below, compared to one from last year at this time (as well as a map and some ice charts).

More fat, healthy bears than last year, enough to keep the Polar Bear Alert folks hopping and tourists in the north happy. Sure doesn’t sound like a suffering population to me. Continue reading

Sea ice habitat Canada update for 23 July 2016 vs. 2014 & the start of bear problems

Sea ice breakup is always a little bit different year to year but since I have the maps archived, take a look at the differences and similarities at this date for this year compared to 2014…

Sea ice extent Canada 2016 July 23_CIS

Sea ice extent Canada 2014 July 23 CIS

Is there evidence that any polar bears – say Western Hudson Bay bears, for example – were negatively affected by sea ice levels in 2014? Not that I’ve heard. In fact, quite the opposite.

Polar bear guide and blogger Kelsey Eliasson, writing from Churchill, Manitoba, had this to say about the condition of bears and freeze-up that year (16 Nov. 2014):

“With these families appearing [heading out to the ice], it really sums up at just what a productive season this has been for the western Hudson Bay population. Any guide who knows their stuff will tell you this was a banner year for cubs, one we haven’t seen in a long time.”

Meanwhile, bears are starting to come ashore and cause a bit of grief:

Southern Hudson Bay (two days ago): “Polar bear shot after wandering through Kashechewan” [see map below for location: the bear shot was a cub that appears to have been separated from its mother and sibling, who were spotted several km away not causing any trouble]

Iqaliut, Baffin Island (this morning): “Polar bear rips 6 tents pitched in Iqaluit park”

Continue reading

Polar bears and W. Hudson Bay sea ice breakup 2016

Breakup for Western Hudson Bay (WHB) is looking to be later than usual this year, given that the average breakup date since 1991 has been July 1 (using a 30% threshold) – only a few days from now – and the ice in WHB is nowhere near 50% coverage, let alone 30%.

Churchill_Polar_Bear_2004-11-15 Wikipedia

Note that few WHB bears come off the ice around Churchill – most come ashore along the southwest coast of Hudson Bay (almost into SHB) and make their way north over the course of the summer to meet the ice as it reforms in the fall north around Churchill – that’s why it’s called a “migration.”

map-WesternHudsonBay

There’s still a lot of ice left in Hudson Bay, as the Canadian Ice Service map for 29 June 2016 (below) shows: Sea ice extent Canada 2016 June 29 CIS

It seems to me that breakup for WHB this year is looking rather like 2014, which was something like a week later than the average since 1991, but time will tell. See below for comparison to 2009 (a late breakup year), 2015, and 2013 (lots of variability!), as well as a discussion of when bears come ashore in relation to this sea ice breakup benchmark.

Continue reading

Tracking polar bears in the Beaufort Sea and the issue of open water in May

A map posted by USGS shows that the 13 polar bears with tags or collars tracked during April 2016 in the Beaufort Sea were down to 9 in May (7 females with collars, 2 subadult or adult males with tags). As two rather large patches of open water formed last month in the Beaufort – mostly due to winds and currents, rather than melt (see animation below, original post here) – a reasonable question is this: how have polar bears dealt with this somewhat unusual condition?

Polar_Bear_Biologist_USFWS_working_with_a_Bear_Oct 24 2001 Amstrup photo

Beaufort Sea breakup in April due to the effects of the Beaufort Gyre (NASA video):

There is also fairly extensive open water in Hudson Bay, so the same question can be asked for that region as well – but fortunately, we have data on tagged bears from both regions to give us a clue as to how the bears are faring.
Continue reading

More Churchill polar bear captures due to increased vigilance not global warming

Polar bear specialists just don’t get it: virtually no one except the ever-gullible media believes their exaggerated stories of doom. Yet they keep trying and with every lie and misrepresentation of fact, they erode the confidence of the public. Unfortunately, it’s not just trust in polar bear specialists that’s being eaten away, it’s trust in science generally.

Churchill polar bear encounters up in 2015_CBC headline Feb 28 2016

This time, it’s a head-line grabbing piece about the number of problem polar bears in Churchill, Manitoba (written by Chinta Puxley) that made the usual media rounds yesterday (CBC News, CTV News, Global News, Huffington Post, Winnipeg Sun, The Globe and Mail). The main culprits are Daryll Hedman, regional wildlife manager for Manitoba Conservation, and polar bear biologist Andrew Derocher.

However, it’s hard not to see that the increased number of bears captured by Manitoba Conservation officers around Churchill can be best explained as a natural reaction by officials to a particularly frightening polar bear attack in 2013. Continue reading

W. Hudson Bay polar bear numbers declined then stabilized, says new paper

Polarbear_Parks Canada Wapusk in August

Western Hudson Bay bear, Wakusp National Park, August 2011.

In the just-published version of their Western Hudson Bay (WHB) population survey conducted in 2011, Nick Lunn and colleagues highlighted in the abstract:

“Our analysis suggested a long-term decline in the number of bears from 1,185 (993-1411) in 1987 to 806 (653-984) in 2011…” 

But they didn’t mention that the 806 estimate for 2011 was based on only a portion of the WHB region (Fig. 1) and has not been accepted by their peers as a valid estimate of the population size. They also failed to mention that the decline occurred due to thick spring ice and/or unsuitable snow conditions for ringed seals between 1989 and 1992 (Fig. 2), which resulted in reduced availability of polar bear prey (as I discussed in detail in Crockford 2015).

They know the “long-term” population decline is what the media will grab onto and run with – rather than the next sentence, which says “In the last 10 years of the study, the number of bears appeared stable due to temporary stability in sea ice conditions.

In other words, their study shows there has been no decline in the population since 2004, which had been predicted to occur (see previous post, Prediction #1), and there has been no trend in either breakup or freeze-up dates between 2001 and 2010 (or since). See previous post on the government report on which this paper is based here.

The bottom line is this: no one is buying this population estimate of 806 bears for the Western Hudson Bay population – both the IUCN Polar Bear Specialist Group and Environment Canada are using Seth Stapleton and colleagues (2014) estimate from their aerial survey done the same year and that official population size number is 1030 bears. Continue reading

Polar bear capital of the world stuck between fear-mongering and science

CBS News published a predictably one-sided “Cover Story” this morning (14 February 2016) about Churchill, Manitoba – the self-proclaimed Polar Bear Capital of the World. 

This is the online version of a Sunday morning TV special that’s not available where I live. It’s yet another example of how the media feeds the politics of polar bears and prevents the advancement of science. Here’s my take on this CBS effort.

Amstrup vs IUCN science_Feb 14 2016_PolarBearScience

Continue reading

Polar bear myths perpetuate from the mouth of stuck-in-the-past Ian Stirling

In my last post, I complained about “vague and misleading statements” made by polar bear specialists and conservation advocates. Here’s a recent example of that phenomena, from veteran polar bear biologist Ian Stirling.


stirling_UA faculty page photo accessed July 22 2012

The magazine of Canada’s North, UpHere, published an interview with Ian Stirling this month. The piece begins:

“No fear-mongering. No exaggeration. For Ian Stirling, it’s purely about the science.”

Yeah, well – judge for yourself. Here’s a sample:

“We have lost on average about half the sea ice that we had in 1979, which is the first year that satellite coverage of the Arctic was taken [he’s talking about September ice here]. Places like Hudson Bay are breaking up three weeks earlier than they used to and freezing up a couple weeks later. We’re going to have even more significant effects over a much wider area in the Arctic. We’re likely to lose another 30 or 40 percent, or even half of the bears that we have today in the middle of the century, and unchecked, we will likely have very few bears left at the turn of the next century. In 2100, we’ll probably just have a few small remaining pockets in the northern Canadian Arctic islands and northern Greenland.”

Read the rest here.

Stirling’s opinion about polar bears and climate change hasn’t changed since at least 2004 despite the following scientific developments: Continue reading