Last night, I was alerted by a reader (h/t MM) to an NBC news report with this headline: “Killer whales’ plight in ice an example of climate change impact, researcher says.” Here’s part of what it says:
The plight of a pod of killer whales that got trapped by ice in a mostly frozen Canadian bay this week was a “good example of what climate change can do” in the Arctic, a researcher said Friday.
The 11 killer whales apparently escaped the ice in Hudson Bay late Wednesday or early Thursday morning, when shifting currents helped break open a path to the sea, according to Petah Inukpuk, mayor of Inukjuak, a remote Inuit village in Quebec where locals had crafted a plan to help the animals, also known as orcas. Other reports said there were 12 orcas in the pod.
The killer whales were hundreds of miles from where they should be at this time of year, such as in the Hudson Strait or the North Atlantic, said Lyne Morissette, a mariner researcher with the Quebec-based St. Lawrence Global Observatory.
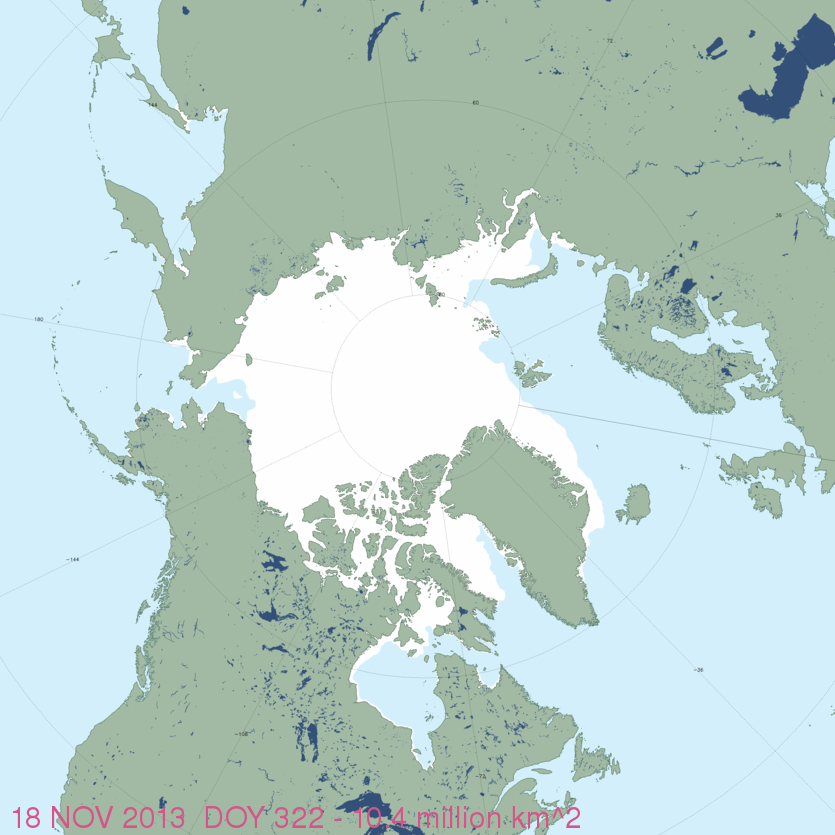
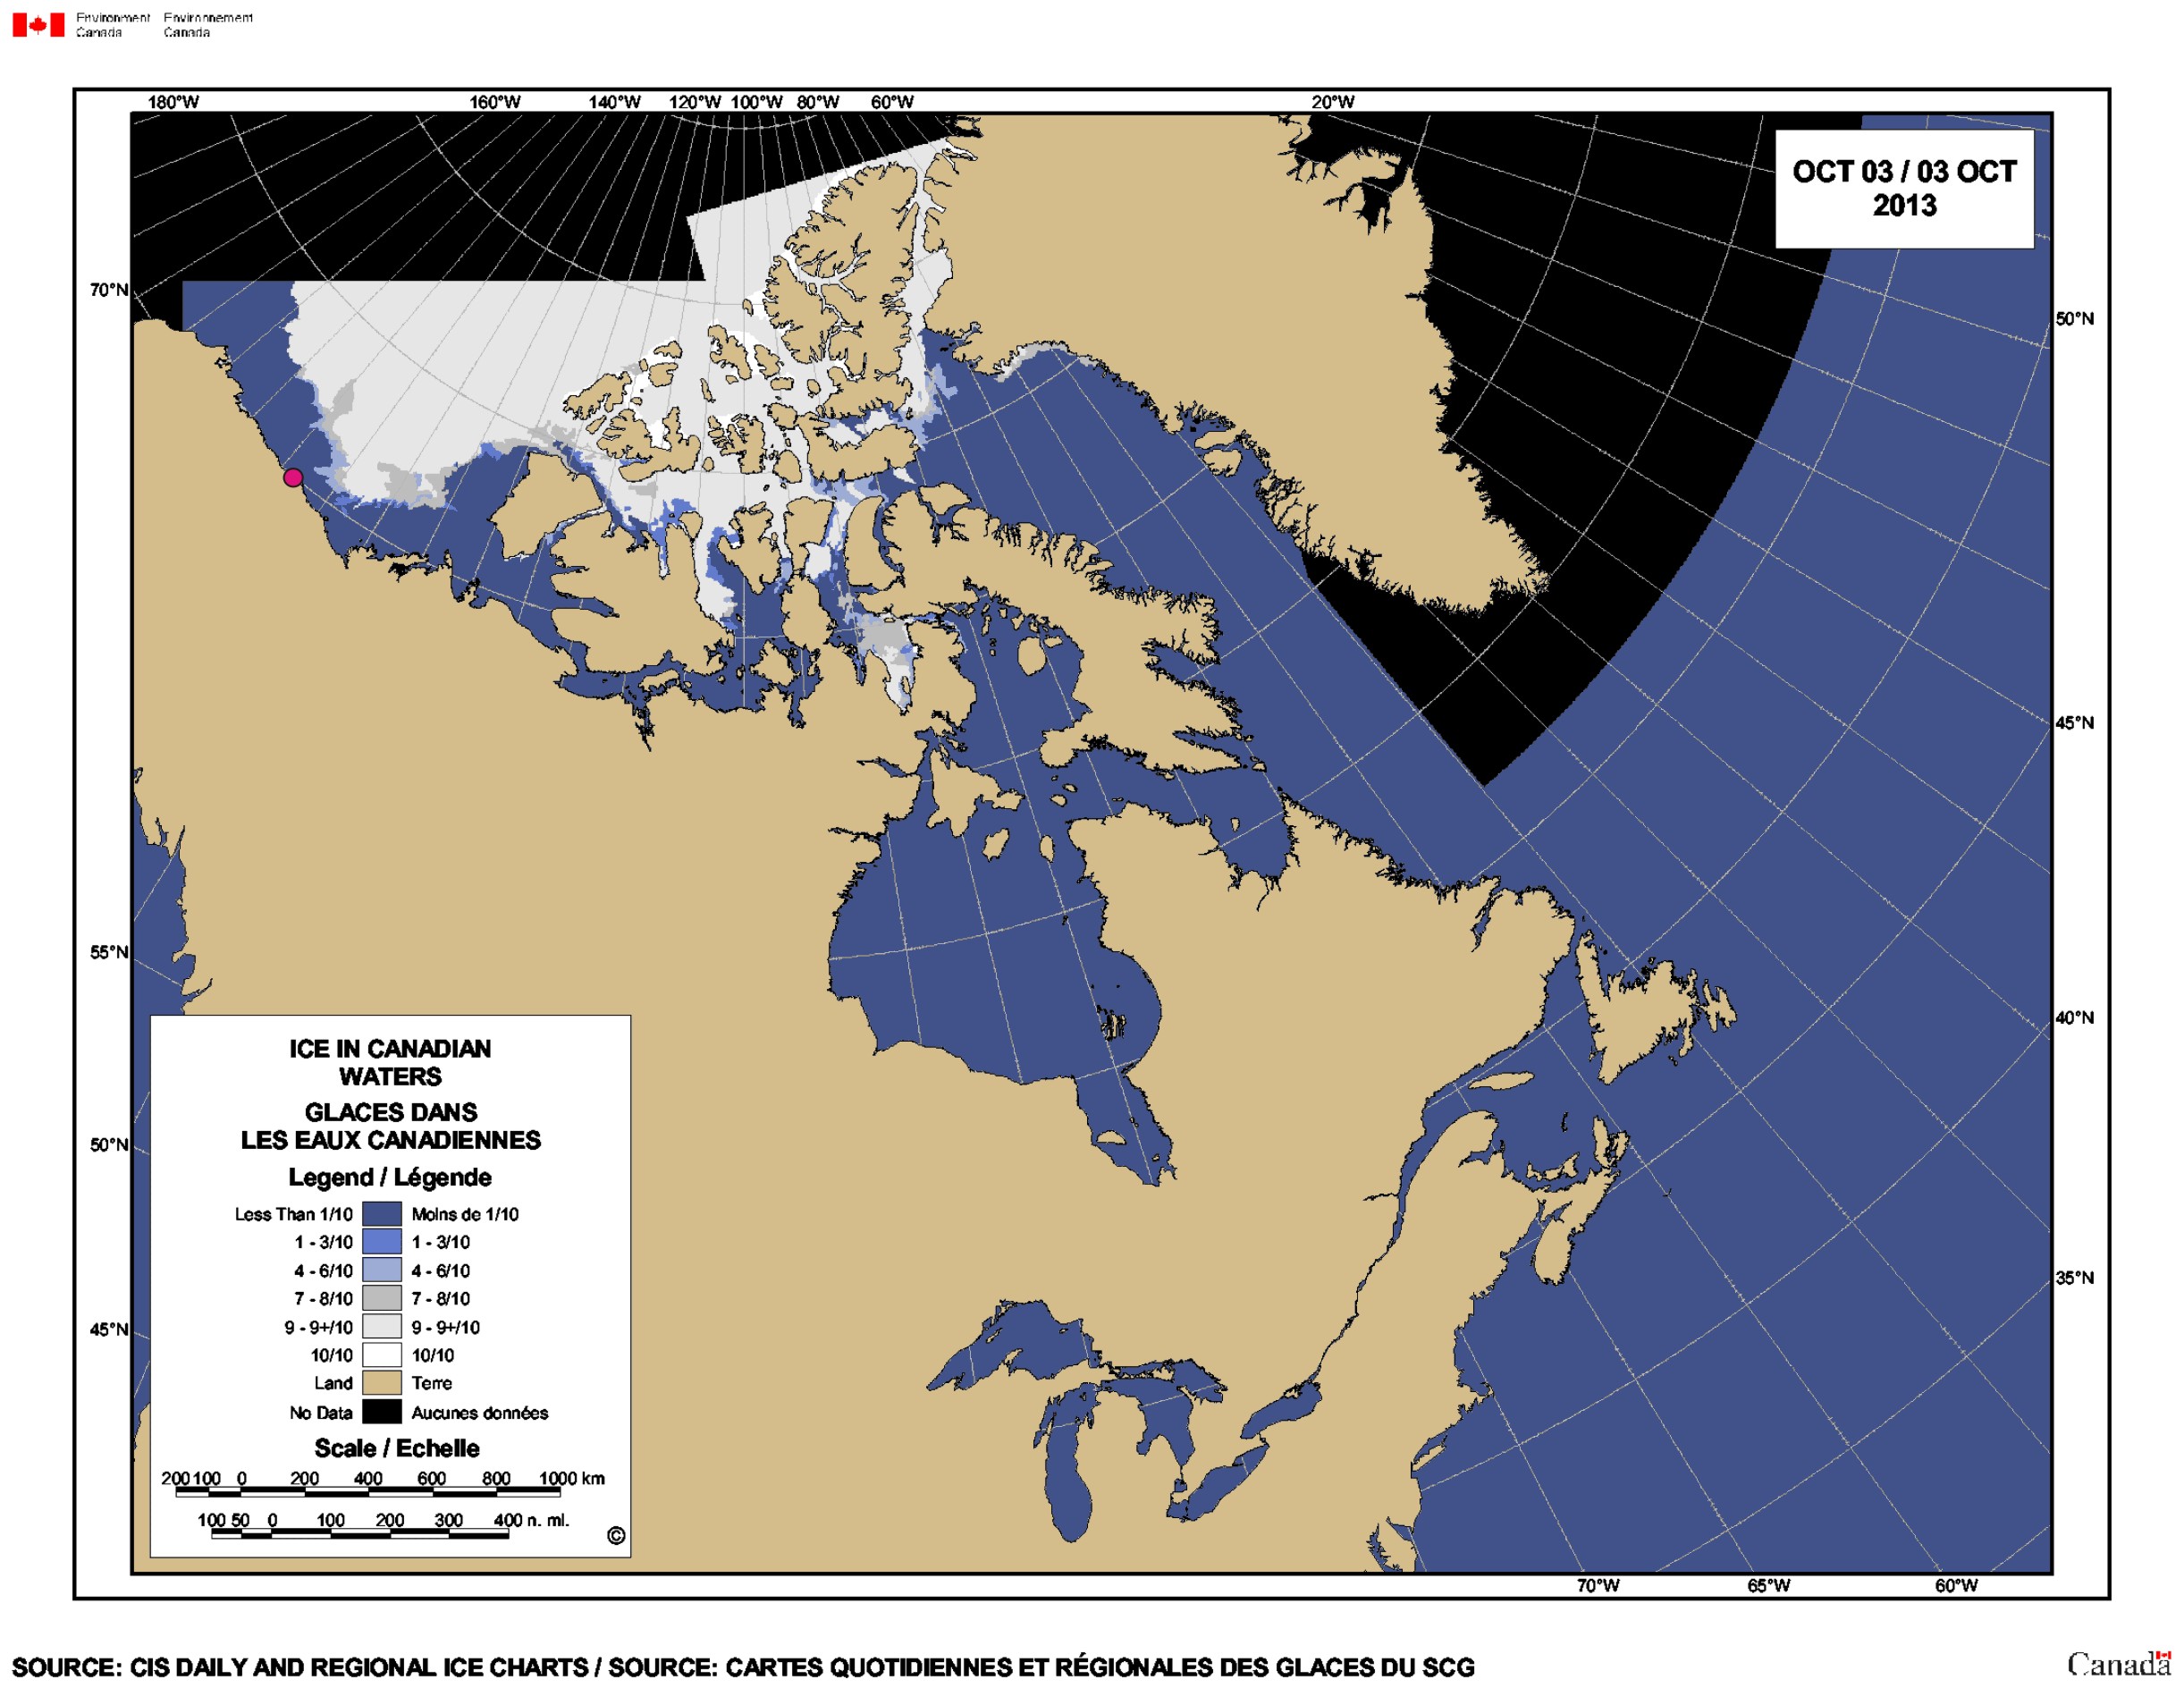
The bay, which normally freezes over in late November or early December only froze over earlier this week.
“It’s definitely a direct effect, a good example of what climate change can do,” she told NBC News on Friday of the orcas’ plight. “All the dynamics of how the ice is going to move and where the ice is going to be — it’s not only about ice melting in the Arctic, you know — it’s the whole dynamics and currents that could change because of climate changes. [my bold]
I take issue, first, with this statement from Morissette (SLGO):
“The bay, which normally freezes over in late November or early December only froze over earlier this week.”
Not true, according to the Canadian Ice Service. Continue reading


You must be logged in to post a comment.