Tag Archives: population size

IUCN Specialist Group now rejects polar bear numbers it used for 2015 IUCN Red List review

Is there a mutiny in the works between the IUCN Red List and the IUCN Polar Bear Specialist Group (PBSG) over polar bear population estimates or has there simply been a breach of ethics? What else explains the fact that some of the subpopulation estimates used by the PBSG to support the status of ‘vulnerable’ for the IUCN Red List in 2015 are unacceptable to them in 2017? And why are the PBSG refusing to embrace the Red List global estimate of 22,000-31,000?

2015 IUCN Red List estimates vs IUCN PBSG 2017

The latest version of the IUCN PBSG status table was posted online 30 March 2017 without fanfare or even a note on their home page. It seems the result came from much discussion at their official meeting last summer (June 2016) that they say continued into early March 2017.

2017 population status update early March headline

PBGS members voted to reject four subpopulation estimates used in the 2015 Red List polar bear status review  — even though the inclusion of those numbers was required in order for the Red List status of ‘vulnerable’ to be upheld. The group has also chosen not to update their global population page with the Red List estimate of 22,000-31,000.

And surprise, surprise — now that only one subpopulation out of nineteen worldwide has shown a recent decline, the PBSG have removed the “trend” columns from their summary table for subpopulations.

Welcome to conservation ‘science’ practiced by IUCN polar bear specialists.
Continue reading

Global polar bear population size is about 28,500 when updates are included

Polar bear numbers have risen since 2005, no matter how you look at it:

Svalbard polar bear Jon Aars_Norsk Polarinstitutt

USGS estimated 24,500 (average) polar bears in 2005.

IUCN estimated 26,500 (average of 22,000-31,000) in 2015
(assessment completed in July, released in November).

Subpopulation surveys completed or reported after July 2015 (Baffin Bay, Kane Basin, Barents Sea) added ~2,000 bears.

This brings the adjusted average total at 2015 to ~28,500.

This may not be a statistically significant increase but it is also not the catastrophic decline that was predicted to occur in association with the abrupt drop of summer sea ice in 2007 to a new average of about 3-5 mkm2 [updated 1 June 2017].

Crockford 2017_Slide 12 screencap

Explained in full in this published paper, pgs 20-21:

Crockford, S.J. 2017 V3. Testing the hypothesis that routine sea ice coverage of 3-5 mkm2 results in a greater than 30% decline in population size of polar bears (Ursus maritimus). PeerJ Preprints 2 March 2017. Doi: 10.7287/peerj.preprints.2737v3 Open access. https://doi.org/10.7287/peerj.preprints.2737v3

UPDATE 26 March 2019: See “Latest global polar bear abundance ‘best guess’ estimate is 39,000 (26,000-58,000)

Science behind the video Polar Bear Scare Unmasked – updated paper now available

Announcing the publication today of Version 3 2 of my paper that tests the hypothesis that polar bear population declines result from rapid declines in summer sea ice, updated with recently available data. Version 2 provides the scientific support for the information presented in the GWPF video published yesterday, “Polar Bear Scare Unmasked: The Sage of a Toppled Global Warming Icon” (copied below).

Crockford 2017 V3 title page graphic 3

[The graphic above was created by me from the title page and two figures from the paper]

Updated 1 March 2017: I added an important reference to the paper below that got overlooked in previous versions (the work of Armstrong et al. 2008, see this post), making Version 3 the latest and most up-to-date.

Crockford, S.J. 2017 V3. Testing the hypothesis that routine sea ice coverage of 3-5 mkm2 results in a greater than 30% decline in population size of polar bears (Ursus maritimus). PeerJ Preprints 2 March 2017. Doi: 10.7287/peerj.preprints.2737v3 Open access. https://doi.org/10.7287/peerj.preprints.2737v3

Version 3, published 2 March 2017, adds an important reference; Version 2, published 28 February, incorporates additional reviewer comments and suggestions received on Version 1, as well as the updates noted above.

Continue reading

Global polar bear population larger than previous thought – almost 30,000

The results of three recently-released studies that were not included in the last IUCN Red List assessment add more than 2,050 bears (on average)1 to the official 2015 global polar bear estimate, a point you won’t likely hear next Monday (27 February) from most polar bear specialists, conservation organizations, their cheerleaders and corporate sponsors on International Polar Bear Day.

global-pb-population-size-graphic2_2017-feb-polarbearscience-corrected

This means the adjusted 2015 global estimate for polar bears should be about 28,500 (average), a marked increase over the official estimate of 26,500 (average) for 2015 — and an even larger increase over the 2005 estimate of about 22,500 (average)2, despite the dramatic loss of summer sea ice since 2007 that we hear about endlessly.

It is increasingly obvious that polar bears are thriving despite having lived through summer sea ice levels not predicted to occur until 2050 – levels of sea ice that experts said would wipe out 2/3 of the world’s polar bears (Amstrup et al. 2007; Crockford 2017 v3).

Update 26 March 2019: see “Latest global polar bear abundance ‘best guess’ estimate is 39,000 (26,000-58,000)

Updated 1 June 2017:  see addition to Footnote 2.
Continue reading

Baffin Bay and Kane Basin polar bears not ‘declining’ concludes new report

The 2016 Scientific Working Group report on Baffin Bay and Kane Basin polar bears was released online without fanfare last week, confirming what local Inuit have been saying for years: contrary to the assertions of Polar Bear Specialist Group scientists, Baffin Bay and Kane Basin subpopulations have not been declining but are stable.

polar-bear-feeding_shutterstock_sm

Until recently, the Baffin Bay (BB) and Kane Basin (KB) polar bear subpopulations, that live between NW Greenland, and Baffin and Ellesmere Islands, were assessed with confidence by the IUCN Polar Bear Specialist Group (PBSG) to be declining due to suspected over-hunting (see 2016 Report, Ch. 1, pg. 4).

It turns out they were wrong.

map-baffinbay

New (2016) polar bear subpopulation estimates for BB and KB:

Baffin Bay 2,826 (95% CI = 2,059-3,593) at 2013

                  [vs. 1546 (95% CI = 690-2,402) expected 2004]

                  vs. 2,074 (95% CI = 1,553-2,595) in 1997

  Kane Basin357 (95% CI: 221 – 493) at 2013

                    vs. 164 (95% CI: 94 – 234) in 1997

[1997 figures from 2015 IUCN Red List estimates, from Supplement, pg. 8); 2004 “expected” figure for Baffin Bay from 2016 SWG report, Ch. 1, pg. 4]

In 2014, Environment Canada’s assessments were ‘data deficient’ for Kane Basin and ‘likely declining’ for Baffin Bay (see map below):
ec_polarbearstatus_and-trends-lg_2010-2014-mapscanada_oct-26-2014

However, the results of this new study (conducted 2011-2013) would likely make KB in the map above dark blue (‘stable’), and BB light blue (‘likely stable’), depending on how the new information is interpreted (given differences in methodology between the 1991-1997 and 2011-2013 counts). Note that a recent paper by Jordan York, Mitch Taylor and others (York et al. 2016) suggested this outcome for Baffin Bay was likely (i.e. ‘stable’) but thought that the status of Kane Basin would remain ‘declining.’

This new information leaves only the Southern Beaufort subpopulation (SB) in a ‘likely declining’ condition, but since that decline was due to thick spring ice conditions in 2004-2006 (Crockford 2017), it does not reflect a response to recent loss of summer sea ice. The new population estimates for Baffin Bay and Kane Basin also suggests that a revision needs to be made to the 2015 IUCN Red List assessment with respect to the global population estimate because polar bears are clearly more abundant in Baffin Bay and Kane Basin than previously thought.

Continue reading

Communicating polar bear science requires a rational approach

My most requested public lecture, Polar Bears: Outstanding Survivors of Climate Change, has been hugely popular with audiences in my Canadian home town of Victoria, British Columbia, and my newly-released book with the same title (based on that lecture) promises to be similarly successful. Here are some thoughts on both.

crockford_outstanding-survivors_lecture-vs-book-jan-2017

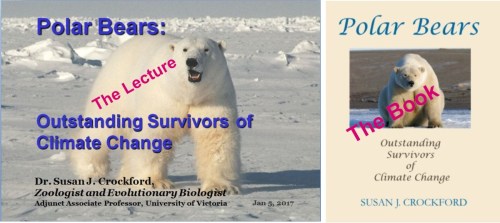
Recently (5 January 5, 2017), I gave another free lecture about polar bears to a local non-profit organization through my university’s Speakers Bureau. I’ve been doing this since 2009, although the shear volume of requests has been much higher this past year than previously. As before, my lecture was warmly received and audience members asked questions indicating they had been listening with an open mind. A colleague I spoke to expressed surprise at that outcome, given where I live.

Keep in mind that Victoria is home to litigation-prone IPCC climate scientist turned BC provincial Green Party politician Andrew Weaver (in whose riding I happen to reside) as well as one of the many targets of fake Nobel Laureate Michael Mann and his over-sensitive ego, veteran climate scientist Tim Ball (who defends the defamation lawsuit filed against him by Mann at trial in Vancouver, B.C. 20 February 2017,  an event which defender of free speech and fellow defendant against Mann’s litigious wrath, Mark Steyn,  has said he’ll be attending). And yes, in a sort of home-town science brawl, Weaver also sued Tim Ball, but that case has not yet gone to court. Victoria is also the constituency of our lone federal Green Party Member of Parliament, Elizabeth May. Canadian journalist Donna Laframboise once described Victoria as “one of the most left-leaning corners of the country.

So it is into this virtual lion’s den of anthropogenic global warming champions that I venture, several times a month, to enlighten adults, teachers, and students who have been left with the impression that there are only a few hundred starving polar bears left in the world.1

The secret to the kind of reception I receive – even in my town – is to present the relevant facts without emotional overtones and let audiences make up their own minds about what they think of the situation.

This latest lecture was not only well received but several audience members bought copies of my kid-friendly Polar Bear Facts and Myths that I had for sale (reviewed here by Kip Hansen).  One member came up afterwards to say he’d been dreading what he’d anticipated would be another polar-bears-are-doomed diatribe but was very pleased at my even-handed, scientific approach.

That’s why I decided to fashion my first fully referenced polar bear science book – and take it’s title – from my most successful public lecture. Audience responses over the years indicated to me that a simple summary would be an appealing approach. Questions from audience members over the years suggested which topics might need a more detailed explanation in the book. The lesson I learned from my lecturing experience was that my book needed a focused style, plenty of color images, and an affordable price.

Consider the table of contents for the new book, where each chapter covers only a few pages:

1. Polar bear & sea ice basics
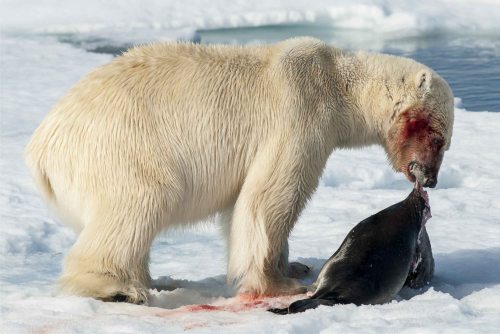
2. Feasting/fasting life of polar bears
3. Evolution & climate change
4. Conservation & protection
5. Failure of the polar bear predictions
6. Biggest threat to polar bears
7. Summary
8. Conclusions

I expect I’ll get some negative fake reviews posted on Amazon for Polar Bears: Outstanding Survivors of Climate Change from the self-appointed moral-high-ground troll network (as they did for Polar Bear Facts and Myths). That’s to be expected for a topic like this. Honest criticism from readers might also be generated, of course, and that’s something all writers can expect, and should welcome.

That said, the best way to counter biased or unconstructive reviews is with honest, heartfelt reviews from readers who have actually read the book. If any of you that have ordered a copy of this book but would like to see a pdf review document in order to post an immediate review, use the contact me form at “Comments/Tips.”

Both Polar Bears: Outstanding Survivors of Climate Change and Polar Bear Facts and Myths are now available in paperback and various ebook formats, including epub and pdf. The little spin-off for preschoolers (Polar Bears Have Big Feet) – because why shouldn’t the little kids have a fear-mongering-free polar bear book with great pictures too? – is available in paperback only.

Footnote

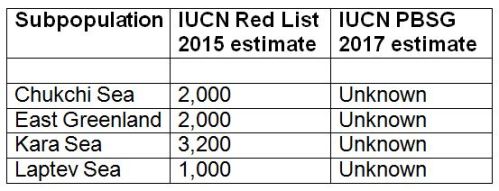
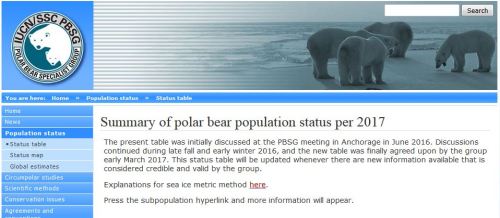
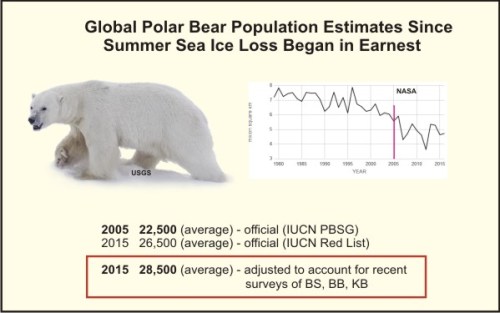
  1. Without exception, every teacher of every school class I have spoken to in Victoria in the past year has been absolutely astonished to learn that the official global population estimate for polar bears is now 22,000-31,000, the highest estimate in 50 years. Virtually all expressed their appreciation for pointing out that simple fact. Hence, Polar Bear Facts and Myths is aimed at those misinformed children, while Polar Bears: Outstanding Survivors of Climate Change is aimed at their teachers, parents, and other influential relatives.

W. Hudson Bay had 1030 polar bears at last count and that is the official number

The IUCN Polar Bear Specialist Group, the IUCN Red List, and Environment Canada (see below) agree that the population size of Western Hudson Bay subpopulation is 1030 or about 1000 bears, based on surveys conducted in 2011.

western-hudson-bay-surveys-2011-compared_polarbearscience-16-dec-2016

For the last few months (most recently, here and here), Andrew Derocher has been telling anyone who will listen that that the number is 800. And no one challenges him – not a single reporter asks where the number comes from, not a single research colleague who knows the truth has publicly stated that Derocher is spreading misinformation.

UPDATE 16 December 2016, half an hour after posting: Add The Atlantic to those accepting Derocher’s misinformation on WHB polar bear numbers without question, and failing to see that because patrols in Churchill were stepped up considerably after a serious mauling occurred in 2013 (because several bears got through their Halloween dragnet), more “problem” bears in Churchill since then only mean the Polar Bear Alert folks are doing their jobs.

But what does The Atlantic conclude, after talking to Derocher?

The Churchill bears…are probably doomed.

Never was a rational book on the science and conservation status of polar bears more desperately needed – it will be available soon.
Continue reading

Hudson Bay could be ice-free in winter within 5-10 years, says seal researcher

Ringed seal biologist Steven Ferguson, in a statement to a reporter from the Winnipeg Free Press, made one of the boldest predictions I’ve ever heard:

crystalball_468x317_predictions_sq


“Hudson Bay could experience its first ice-free winter within 5-10 years.”

You heard it here, folks. It appears Ferguson thinks Hudson Bay was never ice-free in winter even during the Eemian Interglacial, when the Bering Sea was ice-free in winter – something that has not come close happening in recent years (Polyak et al. 2010:1769).

Sounds like a bit of ill-advised grandstanding to me.

Continue reading

An El Niño year late start to freeze-up on Hudson Bay: bears gearing up to hunt

There is no serious ice on the west shore of Hudson Bay yet (as the map below shows) but the winds have just shifted – instead of coming from the south, they are now blowing in from the north.

Freeze-up and a resumption of seal hunting for Western and Southern Hudson Bay polar bears looks imminent. The bears get out on the ice as soon as they are physically able, when the ice is about 3-4 inches thick (about 10 cm).

sea-ice-extent-canada-2016-dec-5_cis

I’m going to let Kelsey Eliasson from PolarBearAlley, on shore at Churchill, convey the gist of the freeze-up situation on the Bay.

Recall that freeze-up was late in both 1998 and 1999 – during the height of that strong El Niño warmth as well as the year following. Continue reading

No correlation between freeze-up dates for Hudson Bay & total Arctic ice cover

Guess which year between 2006 and 2016 had the latest start to freeze-up on Hudson Bay, given that 2012 had the lowest September average and 2007 and 2016 tied for second-lowest (see graph below, from NSIDC), and that sea ice in the Arctic right now is the lowest it’s been for this date since 1979?

sea-ice-sept-averages-graph-only-marked-for-2006-up

If you guessed anything other than 2010, you guessed wrong – in addition, 2006 (not 2016) was second latest.

There is no correlation between Arctic sea ice coverage and freeze-up dates for Western Hudson Bay.

Yet, Polar Bears International (“Save Our Sea Ice”) –  who were surely in and around Churchill in 2010 and 2006 watching polar bears – just posted an alarming statement about local conditions, implying that slow freeze-up of Hudson Bay this year is a reflection of the fact that “sea ice is at a record low across the Arctic.”

They also claim that “…the weather is the warmest we’ve ever seen at this time of year.” That may be true, but if so, it is also meaningless with respect to the progress of freeze-up.

Does no one at PBI remember the very late freeze-up of 2010 or 2006? Odd, that.

Continue reading