Tag Archives: thick ice

Sea ice more than 1.2m thick over Hudson Bay portends a good year for polar bears

The chart below shows what sea ice thickness over Hudson Bay was like at the first week of May in a so-called a ‘good year’ (2019) – when polar bears came off the ice in excellent condition late in the summer and left early in the fall (‘thick first year ice’ is dark green and indicates ice greater than 1.2m thick):

Hudson Bay weekly stage of development 2019 May 6

Hudson Bay ice conditions this year appear to be shaping up to be as good or better than last year for polar bears yet specialist researchers and their cheerleaders have still been claiming that bears in this region – Western and Southern Hudson Bay – are doomed because of poor ice conditions. It’s no wonder they still haven’t published the data they’ve been collecting on polar bear body condition and cub survival over the last 15 years or so (Crockford 2020). With most field work cancelled for this year, what’s their excuse for not getting that done?
Continue reading

Svalbard at end of April again has 6th-7th highest sea ice extent & a lot of very thick ice

For the second time this month, sea ice around Svalbard Norway was the 6th or 7th highest since records began in the late 1960s. Pack ice at the end of April still surrounds Bear Island (Bjørnøya) at the southern end of the archipelago, which is a rare occurrence at this date. These conditions document a recurrent pattern of high ice extent and especially extreme ice thickness in the Barents Sea since last summer.

Bear island 8 March 2019_first bear seen since 2011_Bjørnøya Meteorological Station photo SVALBARDPOSTEN

Continue reading

Sea ice melt in the Arctic Basin leaves an area for polar bears larger than Greenland

Most polar bears that spend the spring feeding in the peripheral seas of the Arctic Basin (such as the Beaufort, Chukchi, Kara, and Barents Seas) remain on the persistent pack ice of the central Arctic during the summer and this August, that refugium is still larger than Greenland. Most of these bears do not use this July-September Arctic Basin ice as a hunting platform unless they are very lucky: the few seals available are hard to catch. For the most part, polar bears fast or eat very little during the summer whether they are on land or on ice (see references in this post).

Svalbard polar bear fall 2015_Aars

Since early June, sea ice experts have been wringing their hands over the melting of Arctic sea ice and offering breathless speculation that this year’s September minimum could be – gasp! – as low as or less than 2012 or even less. But now, as the graph of ice cover at 28 August shows below, that outcome is looking not just unlikely but virtually impossible (the blue line is 2019 extent, red dashed line is 2012, and the brown line is 2016):

Sea ice extent 2012 and 2016 vs 2019 with 2x deviation at 28 Aug_NSIDC interactive

As expected, the failure of the ice to remain on track to set a new record September low due to global warming is shrugged off with a reminder that summer ice extent “is sensitive to changes in daily weather conditions.”

Continue reading

Shockingly thick first year ice between Barents Sea and the North Pole in mid-July

In late June, one of the most powerful icebreakers in the world encountered such extraordinarily thick ice on-route to the North Pole (with a polar bear specialist and deep-pocketed, Attenborough-class tourists onboard) that it took a day and a half longer than expected to get there. A few weeks later, in mid-July, a Norwegian icebreaker also bound for the North Pole (with scientific researchers on board) was forced to turn back north of Svalbard when it unexpectedly encountered impenetrable pack ice.

Franz Josef Land polar bear 2019 no date_Photo by Michael Hambrey_sm

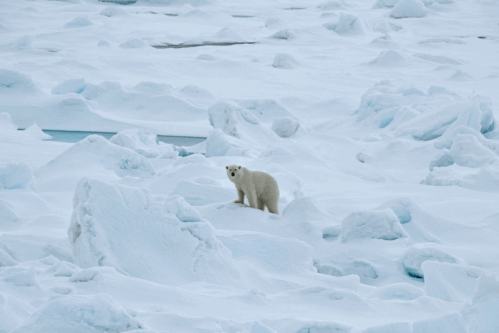
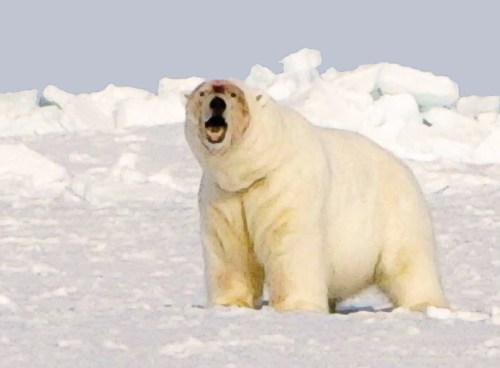
A polar bear on hummocked sea ice in Franz Josef Land. Photo by Michael Hambrey, date not specified but estimated based on tour dates to be 22 or 23 June 2019.

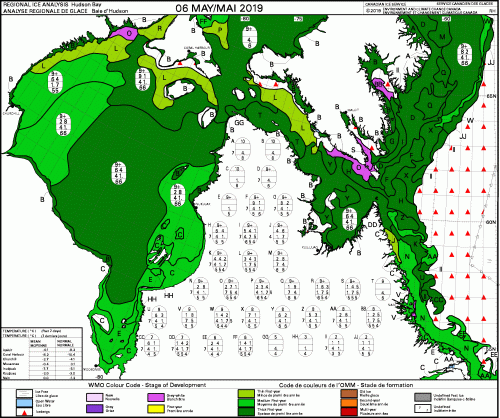
Apparently, the ice charts the Norwegian captain consulted showed first year ice – ice that formed the previous fall, defined as less than 2 m thick (6.6 ft) – which is often much broken up by early summer. However, what he and his Russian colleague came up against was consolidated first year pack ice up to 3 m thick (about 10 ft). Such thick first year ice was not just unexpected but by definition, should have been impossible.

Ice charts for the last few years that estimate actual ice thickness (rather than age) show ice >2 m thick east and/or just north of Svalbard and around the North Poie is not unusual at this time of year.  This suggests that the propensity of navigational charts to use ice ‘age’ (e.g. first year vs. multi-year) to describe ice conditions could explain the Norwegian captain getting caught off-guard by exceptionally thick first year ice. It also provides an explanation for why the polar bear specialist onboard the Russian icebreaker later failed to explain that first year ice of such shocking thickness was truly extraordinary, not just a bit thicker than usual.

Continue reading

Amstrup & colleages can’t refute my critique of their 2007 polar bear survival model, Part 2

Polar bear specialists Andrew Derocher and Steven Amstrup recently spent inordinate energy trying to refute the opinion piece I’d written for the Financial Post in celebration of International Polar Bear Day last month, ignoring my fully referenced State of the Polar Bear Report for 2017 that was released the same day (Crockford 2018) and the scientific manuscript I’d posted last year at PeerJ Preprints (Crockford 2017).

polar_bear_USFWS_fat Chukchi Sea bear

Their responses use misdirection and strawman arguments to make points. Such an approach would not work with the scientific community in a public review of my paper at PeerJ, but it’s perfect spin for the self-proclaimed “fact-checking” organization called Climate Feedback. The result is a wildly ineffective rebuttal of my scientific conclusion that Amstrup’s 2007 polar bear survival model has failed miserably.

This is Part 2 of my expose, see Part 1 here.
Continue reading

Hudson Bay, Davis Strait and Foxe Basin sea ice highest since 1992

We are seeing one of the extremes in Hudson Bay sea ice variability this year, not only in extent but in distribution of ice. Ice coverage on Hudson Bay this year at 28 July was twice what it was in 2009, the last “late” ice breakup year for which detailed ice maps are available (409 vs. 204 thousand km2), according to NSIDC MASIE ice maps. Canadian Ice Service data show 2015 coverage for the week of 30 July was the highest since 1992.

Churchill_Polar_Bear_2004-11-15 Wikipedia

The odd pattern of ice distribution presents a conundrum. Have a look at the maps and graphs below.

Continue reading

Tracking polar bears in the Southern Beaufort May 2015 – thick ice and polynyas

Polar bear habitat in the Southern Beaufort for May 2015 was a contrast between the development of recurring polynyas (patches of open water) and tremendously thick sea ice. So it’s interesting to see where the polar bears tagged by USGS biologists chose to hang out.

Polar_Bear_Biologist_USFWS_working_with_a_Bear_Oct 24 2001 Amstrup photo

The total number of bears being tracked in May – 23 – is down markedly from the 30 bears USGS biologists started with in April.

Most of the collared bears were concentrated in May along the shore lead (crack of open water) that normally develops between the shorefast ice and the pack ice offshore. That’s especially understandable this year, since most of that pack ice is 3-5 m thick (10-16 ft) – see the maps below.
Continue reading