Category Archives: Conservation Status

Polar bears have not been harmed by sea ice declines in summer – the evidence

PB  logo colouredThe polar bear biologists and professional activists of the IUCN Polar Bear Specialist Group (PBSG) continue to insist that since 1979 increasingly smaller amounts of Arctic sea ice left at the end of summer (the September ice minimum) have already caused harm to polar bears. They contend that global warming due to CO2 from fossil fuels (“climate warming” in their lexicon) is the cause of this decline in summer ice.

In a recent (2012) paper published in the journal Global Change Biology (“Effects of climate warming on polar bears: a review of the evidence”), long-time Canadian PBSG  members Ian Stirling and Andrew Derocher (both of University of Alberta) summarized their position this way:

“Climate warming is causing unidirectional changes to annual patterns of sea ice distribution, structure, and freeze-up. We summarize evidence that documents how loss of sea ice, the primary habitat of polar bears (Ursus maritimus), negatively affects their long-term survival”

I’ve spent the last year examining their evidence of on-going harm, but in addition, I’ve looked at the evidence (much of it not mentioned in the Stirling and Derocher paper1) that polar bears have either not been harmed by less sea ice in summer or have thrived in spite of it.

This is a summary of my findings. I’ve provided links to my original essays on individual topics, which are fully referenced and illustrated. You are encouraged to consult them for complete details. This synopsis (pdf with links preserved, updated; pdf with links as footnotes, updated) complements and updates a previous summary, “Ten good reasons not to worry about polar bears” (pdf with links preserved; pdf with a foreword by Dr. Matt Ridley, with links as footnotes).

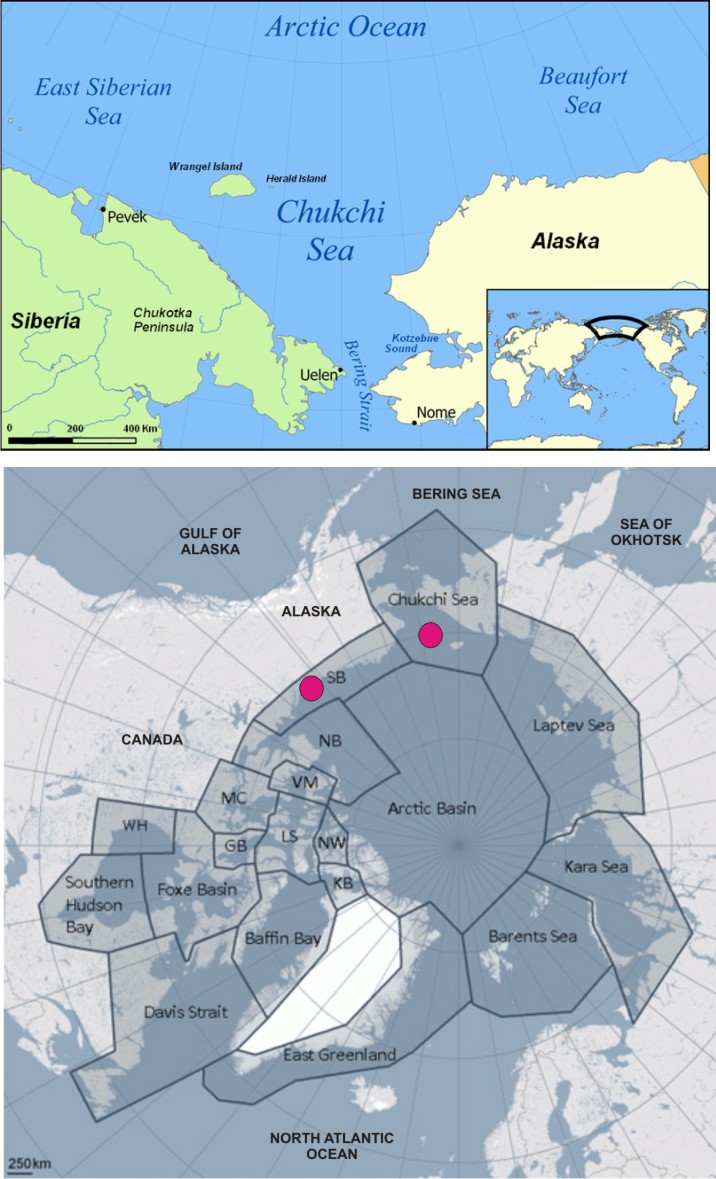
Update 8 September 2013: to include links to my post on the recently published Chukchi population report; updated pdfs have been added above.

Update 22 January 2014: added figure comparing March vs. September sea ice extent using the same scale, from NOAA’s “2014 Arctic Report Card,” discussed here.
Continue reading

Southern Hudson Bay subpopulation status, farthest south of all polar bears

“The Arctic” is a bit hard to define. While the Arctic Circle works as a good boundary for some purposes and the 100C isotherm for July for others, neither work for polar bears because several subpopulations live well south of these limits (Fig. 1).

In the east, Western Hudson Bay, Southern Hudson Bay and Davis Strait are all located well south of the Arctic Circle and the first two (and half of Davis Strait) are beyond the 100C July isotherm as well. In the western Arctic, the Chukchi Sea subpopulation is within the 100C July isotherm but at least half of its bears reside south of the Arctic Circle (Fig. 1) in the Bering Sea (see previous post here).

Unique amongst all of these is Southern Hudson Bay – all of its polar bears make maternity dens and/or spend the summer south of 600N.

Southern Hudson Bay (SH) bears live in the Canadian provinces of Ontario, while Western Hudson Bay (WH) bears reside in Manitoba and Nunavut. The two groups mix over the winter but appear to spend the summer/fall in their respective regions (Stirling et al. 2004). [See previous posts on Western Hudson Bay bears here, here, and here]

“Further south” in the Arctic usually means warmer, with open water present more weeks every summer, sea ice for fewer weeks over the winter. So, shouldn’t the bears of Southern Hudson Bay be already suffering more harm from global warming than virtually all other subpopulations, including those in Western Hudson Bay?

After all, Western Hudson Bay bears appear to have experienced a statistically significant decline in numbers, among other effects (Regehr et al. 2007; Stirling and Derocher 2012) — surely Southern Hudson Bay bears are doing worse?

You’d think so, but they aren’t.

Figure 1. Boundary limits for “the Arctic” (top map) such as the Arctic Circle (dashed line) or the 100C isotherm for July (solid red line) would not include several polar bear subpopulations that live south of these.

Figure 1. Boundary limits for “the Arctic” (top map) such as the Arctic Circle (dashed line) or the 100C isotherm for July (solid red line) would not include several polar bear subpopulations that live south of these.

UPDATED October 28, 2014: Reference added, Obbard et al. 2013 (aerial survey results).
Continue reading

Global population of polar bears has increased by 2,650-5,700 since 2001

The official population estimates generated by the IUCN Polar Bear Specialist Group (PBSG) give the impression that the global total of polar bears has not changed appreciably since 2001:

2001 PBSG report                  21,500-25,000

2005 PBSG report                  20,000-25,000

2009 PBSG report                  20,000-25,000

2013 PBSG website                20,000-25,000

2015 IUCN Red List              22,000-31,000 [see latest update note]

However, some accounting changes were done between 2001 and 2009 (the latest report available) that mean a net increase in numbers had to have taken place (see summary map below and previous post here. Note this is a different issue than the misleading PBSG website graphic discussed here).

And while it is true that population “estimates” are just that — rather broad estimates rather than precise counts — it is also true that nowhere do the PBSG explain how these dropped figures and other adjustments were accounted for in the estimated totals. 

The simple details of these changes are laid out below, in as few words as I could manage, to help you understand how this was done and the magnitude of the effect. It’s a short read — see what you think.

UPDATE 15 May 2016: In late November 2015, the IUCN Red List of Threatened Species published a new assessment for polar bears that estimated the global population at 22,000-31,000 and stated the trend was ‘Unknown’. See details here and here – which includes links to the official report and the press release. Sorry for the delay in updating this post.

UPDATE 31 May 2015: See the latest population numbers here.

UPDATE 5 December 2014: Links to more recent posts relevant to this issue added below. [including this one: Status of Canadian polar bear populations has been changed – more good news October 28, 2014

UPDATE February 14, 2014a new status table has been released, see new post here 

UPDATE February 18, 2014 — see graphs of the 1981-2013 estimates here.

Polar bear subpopulations as defined by the PBSG: Top, in the 2001 report; Bottom, 2009 report. Map courtesy PBSG, with a few labels added and the subpopulations identified where “accounting” changes or adjustments to estimates took place.SB, Southern Beaufort; NB, Northern Beaufort; VM, Viscount Melville; MC, M’Clintock Channel; LS, Lancaster Sound; GB, Gulf of Boothia; NW, Norwegian Bay; KB, Kane Basin; WH, Western Hudson Bay. Click to enlarge.

Polar bear subpopulations as defined by the PBSG: Top, in the 2001 report; Bottom, 2009 report. Map courtesy PBSG, with a few labels added and the subpopulations identified where “accounting” changes or adjustments to estimates took place.
SB, Southern Beaufort; NB, Northern Beaufort; VM, Viscount Melville; MC, M’Clintock Channel; LS, Lancaster Sound; GB, Gulf of Boothia; NW, Norwegian Bay; KB, Kane Basin; WH, Western Hudson Bay. Click to enlarge.

Continue reading

Chukchi/Bering Sea ringed seals doing better despite declines in ice and snow: new study

Ringed seal pup in snow cave

Previously, I highlighted new research results that showed, contrary to expectations, polar bears in the Chukchi Sea subpopulation are doing better – despite declines in extent of September sea ice – since the 1970s. So it might not come as much of a surprise to find that the same is true for the primary prey of polar bears in the Chukchi and Bering Seas, Arctic ringed seals (Phoca hispida hispida).

Surprisingly, less than 6 months after Arctic ringed seals were placed on the American list of “threatened” species (under the ESA, see previous post here), actual research in Alaska has shown that declines in sea ice have proven better for ringed seals, not worse.

At a presentation given at the Lowell Wakefield Fisheries Symposium in March (Anchorage, Alaska) [program and links to pdfs here] Justin Crawford, a biologist with the Alaska Department of Fish and Game (ADF&G) presented the results of ringed seal research conducted by himself and fellow ADF&G biologist Lori Quakenbush in the Chukchi and Bering Seas (posted online by the event organizers, see references below).

As for polar bears, the Crawford and Quakenbush presentation provides some very interesting details on the status of Chukchi and Bering Sea ringed seals over the last 40 years, and contains some mighty “inconvenient” conclusions that should raise some eyebrows.

I’ve summarized these details and conclusions below in point form, with a map.
Continue reading

Chukchi polar bear status contradicts the “message” – new details

Previously, I summarized preliminary results of polar bear research in the Chukchi Sea undertaken between 2008 and 2011 by US Fish & Wildlife biologist Eric Regehr and US Geological Survey researcher Karyn Rode. At the time, a peer-reviewed paper on this study was promised shortly.

It now appears this paper is indeed on the way. I’m sure of that because a few weeks ago, I came across a conference presentation given by Karyn Rode that is a summary of the upcoming Chukchi research paper. The title of both presentation and ‘in review’ paper is:

“Variation in the response of an Arctic top predator experiencing habitat loss: feeding and reproductive ecology of two polar bear populations.

Rode’s slide presentation (given at the annual Lowell Wakefield Fisheries Symposium at the end of March, in Anchorage, Alaska) was posted online by the symposium organizers. It provides some very interesting details on the status of Chukchi Sea bears compared to bears in the Southern Beaufort, and contains some mighty “inconvenient” conclusions that should raise some eyebrows.

I’ve summarized these details and conclusions below in point form, below the maps.

Figure 1. Chukchi and Beaufort Seas (from Wikipedia), upper. ‘Chukchi Sea’ polar bears are shared between the USA and Russia; ‘Southern Beaufort’ bears are shared between the US and Canada, lower (from PBSG, with labels added). Pink dots are the subpopulations featured in the Rode et al. presentation and upcoming paper.

Figure 1. Chukchi and Beaufort Seas (from Wikipedia), upper. ‘Chukchi Sea’ polar bears are shared between the USA and Russia; ‘Southern Beaufort’ bears are shared between the US and Canada, lower (from PBSG, with labels added). Pink dots are the subpopulations featured in the Rode et al. presentation and upcoming paper.

Continue reading

Great polar bear red herring in the Southern Beaufort

Red herring iconWe know that thick-ice springs occurred in 1974, 1975, 1986, 1992, 2004, and 2005 in the former ‘Eastern Beaufort’ – now the southern portion of the ‘Northern Beaufort’ and the eastern portion of the ‘Southern Beaufort.’ We know that these severe spring ice conditions negatively impacted both polar bears and ringed seals in this region every decade since the 1960s because the effects have been documented by numerous studies conducted in April through May for polar bears (Amstrup et al. 2006; Cherry et al. 2009; Pilfold et al. 2012; Stirling 2002; Stirling and Lunn 1997; Stirling et al. 1980; Stirling et al. 1993; Stirling et al. 2008) and in June and July for ringed seals (Harwood et al. 2012; Smith 1987), see previous posts here, here, and here.

For example, even though Ian Stirling and colleagues argued in their 2008 paper that the thick spring ice conditions in 2004, 2005 and 2006 (but not those in previous decades) were caused by storms initiated or intensified by greater amounts of open water in previous summers, they did not deny that the thick-ice springs occurred. They stated quite clearly that:

The 1960s, 1970s, and 1980s each experienced a two- to three-year decline in seal productivity in the eastern Beaufort Sea and Amundsen Gulf, associated with heavy ice conditions, around mid-decade. Each was followed by a decline in polar bear reproduction and condition, after which both seal and bear populations recovered (Smith, 1987; Harwood et al., 2000; Stirling, 2002). The beginning of each of those three periods was associated with heavy ice conditions through the winter before the reproductive decline of the seals, followed by a late spring breakup.” [my bold]

So, I have to say, I was shocked but not surprised to find that in the more recent scientific literature, the phenomenon of thick-ice springs every decade in Southern and Northern Beaufort has been deliberately ‘disappeared.’ 

Not surprised because I suspected it had happened — this issue was a feature of the Stirling and Derocher (2012) paper from late last year which was the topic of my very first blog post, “Cooling the polar bear spin.

However, I think it is important to document how the transmogrification of sea ice effects on polar bears was managed in the scientific literature so that everyone can see exactly what has been done. In a truly astonishing move for what is supposed to be a field of science, thick-ice springs have been effectively replaced by an open-water red herring as the scourge of Southern Beaufort polar bears.

Continue reading

Guest post: How ‘science’ counts bears

This essay by Dr. Jim Steele, professor emeritus, San Francisco State University, is reblogged from a July 3 2013 post at WUWT post, with Dr. Steele’s permission. I am not a field biologist and have never done a mark-recapture study but Dr. Steele has. His perspective on the way polar bear biologists count bears and estimate survival in the Southern Beaufort is a perfect companion to yesterday’s post, a related post that I’ll put up later this week, and this one from December, among others. I’ve added links to the references cited in this essay where they are available, as is my custom. See the original post for Jim’s responses to comments and questions.

———————————————————————
Guest post by Jim Steele   “How ‘science’ counts bears”

The Inuit claim “it is the time of the most polar bears.” By synthesizing their community’s observations they have demonstrated a greater accuracy counting Bowhead whales and polar bears than the models of credentialed scientists. To estimate correctly, it takes a village. In contrast the “mark and recapture” study, which claimed the polar bears along South Beaufort Sea were victims of catastrophic global warming and threatened with extinction, relied on the subjective decisions of a handful of modelers.

In mark and recapture studies, the estimate of population abundance is skewed by the estimate of survival. For example, acknowledging the great uncertainty in his calculations of survival, in his earlier studies polar beat expert Steven Amstrup reported three different population estimates for bears along the South Beaufort Sea. If he assumed the adult bears had an 82% chance of surviving into the next year, the models calculated there were 1301 bears. If survivorship was 88%, the abundance climbed to 1776 bears. If he estimated survivorship at a more robust 94%, then polar bear abundance climbed to 2490.1 Thus depending on estimated survival rates, a mark-and-recapture study may conclude that the population has doubled, or that it has suddenly crashed.

Here are the simplified basics of estimating survival.

Continue reading

Misleading “State of the Polar Bear” graphic still not fixed

UPDATE FEBRUARY 19, 2014The misleading “State of the Polar Bear” graphic is now GONE (as of January 31, 2014). A new 2013 status table is offered by the PBSG here. It has detailed text explanations and harvest information, with references, hyperlinked to each subpopulation entry (“Press the subpopulation hyperlink and more information will appear“) and may have replaced the “State of the Polar Bear” graphic that the PBSG commissioned for upwards of US$50,000, although the PBSG website says it is being “updated [A pdf copy of the 2013 colour table is here, and my commentary on it is here.] I have left the original post as is, below.

This is an update regarding the IUCN Polar Bear Specialist Group (PBSG)’s fancy, multilevel State of the Polar Bear web graphic that I discussed previously here, here, and here.

To refresh your memory, two points about this graphic stand out, both regarding polar bear population estimates:

1) The population estimates listed on the Nations map (copied below) add up to 22,600-32,000 – far higher than the official estimate of 20,000-25,000 polar bears worldwide.

2) The population estimates listed on the upper layer of the Subpopulation map add up to just 13,036 – not even close to the official estimate of 20,000-25,000 polar bears worldwide.
Continue reading

Matt Ridley’s foreword to my “10 good reasons not to worry” list – “We should be listening to Susan Crockford”

Benny Peiser over at the Global Warming Policy Foundation has just posted an essay by well-known author Matt Ridley (including “The Rational Optimist”), entitled “We should be listening to Susan Crockford” which is included as a foreword to a pdf of my earlier post, “Ten good reasons not to worry about polar bears.”

This stand-alone pdf is especially suitable for sharing with friends and policy makers.

I encourage you to have a look.

Polar bear spin reaches epic proportions at Bangkok CITES meeting

As I mentioned here in an update to my March 7th post, Damian Carrington at the Guardian Environment blog had this telling quote about the CITES deliberations that took place prior to the vote to ban polar bear trade (by uplisting its status from Appendix II to Appendix I):

As the debate raged, national delegates from other countries got confused by the strident but conflicting claims. “Where is the truth? Is it true that the polar bear is declining. Is it true that trade is increasing? We need to know,” said the Egyptian delegate.[my bold]

Indeed. Was there “truth” in the presentations heard by delegates? By that I mean, honest presentations of facts so that delegates could make up their own minds, or facts loaded with spin to sway the decision one way or another? I wasn’t there so I can’t say. But we can get some impression of what might have been said from two press releases statements issued after the vote failed by two parties that were actively promoting acceptance of the US-led proposal.[Update: Humane Society Press Release is here] Continue reading