Tag Archives: Hudson Bay

Hudson Bay freeze-up average this year – not late

Freeze-up in Western Hudson Bay is finally underway. It’s no later this year than average, similar to last year.

This rather contradicts the hysterical hue and cry from the tag-team of Polar Bears International (PBI) spokesperson Steven Amstrup and Guardian reporter Suzanne Goldenberg last week during PBI’s “Polar Bear Week” propaganda blitz (see previous posts here, here, and here), 

So much for the trend towards later freeze-up dates that PBI says is endangering polar bears in Western Hudson Bay.

On-the-ground observers confirm polar bears are preparing to move out and sea ice maps show the ice is forming very rapidly — see maps and quotes below.

Continue reading

Eemian excuses: the warm was different then, polar bears were fine

Today I’ll discuss the response by Polar Bears International representative Steven Amstrup to a comment submitted during their recent “webchat” at The Guardian (Wednesday, November 6), which had to do with the fact that polar bears survived warm periods in the geological past, particularly interglacials.

[Here’s a pdf file of all the questions that were answered by PBI staff: PBI webchat Q&A, also available here]

This is the comment (the first portion of #4 on my list), submitted by MarkBLR:

There was a paper in Science magazine last year (link …) indicating that polar bears became a distinct species about 600kya (+/- 300k years).

This means that they have survived at least two (and possibly eight) previous inter-glacials, in particular the Eemian (130kya to 110kya), when temperatures in the Arctic were 5 to 8 degrees Celcius warmer than current temperatures for several thousand years.

Note that their numbers apparently decreased significantly during the Eemian, and slowly increased as temperatures cooled, but “climate change” was not enough on its own to make them extinct. [my bold]

[We can perhaps forgive Mark for not being able to spell “Celsius” correctly, but Amstrup (see below) has no excuse. The paper in Science Mark refers to is Hailer et al. 2012, discussed in a previous post here. Note that the actual question Mark asked is not included here because Amstrup responded to this portion of his comment only]

Amstrup tries to convince Mark and other readers that polar bear resilience through Eemian warming is irrelevant to the issue of future survival, which I’ll demonstrate is not the case at all.

Here is what Amstrup had to say:
Continue reading

Polar bear habitat update for October 31, 2013

Here’s the ground-truth follow-up to my suggestion of what polar bear habitat would likely look like 6 weeks after the minimum extent was reached this year – which was looking then like it would mirror 2009.

You’ll find my discussion, posted on September 22, here. At that point (September 13), ice extent was 5.1 million square kilometers; now it is 9.1 million square kilometers (Fig.1).

Figure 1. Oct 30 2013 Maisie sea ice extent, 9.1 mkm2. This does not take thickness or concentration into account.

Figure 1. Oct 30 2013 Maisie sea ice extent, 9.1 mkm2. Click to enlarge.

Have a look at the maps below: Fig. 2 to see how ice extent at October 31st compares to ice extent at the end of October 2009, and Fig. 3 to see what ice concentrations looked like in the Canadian Arctic.

Continue reading

What polar bear habitat could look like in another 5-6 weeks

According to the National Snow and Ice Data Center (NSIDC, Sept. 20 report), the annual sea ice minimum extent was reached on Sept. 13, 2013.

At 5.10 million square kilometers, this year’s low was a whopping 1.69 million square kilometers above the minimum extent for 2012 (which was the lowest since 1979) and well within two standard deviations of the 1979-2010 average. (Two standard deviations: “Measurements that fall far outside of the two standard deviation range or consistently fall outside that range suggest that something unusual is occurring that can’t be explained by normal processes”).

The minimum extent for 2013 is virtually indistinguishable from the minimum for 2009, which was 5.13 million square kilometers. The ice was distributed a bit differently in 2009 – more in the east and less in the west — than it was this year (see Fig. 1 below).

Figure 1. Using the JAXA “Sea ice monitor” feature, I plotted the date the 2013 minimum was reached (September 13, 5.10 million square kilometers, white) with an overlay (purple) for the same date back in 2009 (September 13, 2009, 5.13 million square kilometers), when that year’s minimum was reached (according to the NSIDC report). Areas of overlap are pink.

Figure 1. I used JAXA to plot the date the 2013 minimum was reached (September 13, 5.10 million square kilometers, white) with an overlay (purple) for the same date back in 2009 (September 13, 2009, 5.13 million square kilometers), when that year’s minimum was reached. Areas of overlap are pink.

You’ll know from previous discussions here that the annual minimum reached in late summer has little impact on polar bear health and survival (see excellent summary of the evidence for that here). What matters most to polar bears is the presence of ample ice in spring and early summer (March-June), which is their critical feeding period.

But after the fast that many polar bears endure over the height of the summer, they are eager to get back onto the ice and resume hunting. When in the fall does that become possible?

I wondered what the similarity in extent for 2013 and 2009 might tell us about polar bear habitat development over the next month or so.

In other words, what might polar bears this year expect in the way of sea ice development by say, the end of October? When might they be able to start hunting?

Continue reading

Record sea ice loss in 2007 had no effect on polar bears, Chukchi study confirms

One aspect of the recently published study on Chukchi Sea polar bears (Rode et al.2014 [now in print] 2013; see here and here) has not been stressed enough: their finding that the differences in overall condition between bears in the Chukchi and Southern Beaufort Seas came down to disparities in spring feeding opportunities and therefore, the condition of spring sea ice.

The fact that spring — not summer — is the most critical period for polar bears is something I’ve pointed out before (see here and here, for example) but it’s worth repeating at this time of year, when all eyes are on the annual ice minimum. It is often treated as a given that the decline in extent of summer sea ice in the Arctic since 1979 has been detrimental to polar bears. However, this is an assumption that we can now say is not supported by scientific evidence (see summary of that evidence here).

The results published by Rode et al. (2014 2013) not only add further support to the conclusion that declines in summer sea ice have not harmed polar bears, but should put the matter to rest – unless new evidence to the contrary is produced.

Chukchi bears, the report tells us, had more food available in the spring than Southern Beaufort bears (see map below) and this was the primary reason that bears were doing very well in the Chukchi and not quite as well in the Southern Beaufort. And because the polar bears for this study were captured and measured in mid-March to early May, from 2008 to 2011, they reflect spring-time conditions for 2008-2011 as well as year-round conditions from 2007 through 2010.

This means that the annual low ice extent for 2007 (record-breaking at the time), in the fall before this study began, had no discernible negative effect on either Chukchi or Southern Beaufort polar bears – and neither did similarly low annual minimums in two of the three remaining years of the study (Fig 1).

Figure 1. Sea ice extent at August 27, 2007 – the lowest extent that year (downloaded September 15, 2013 from IARC-JAXA, Arctic Sea-ice Monitor). At the time, it was the lowest extent recorded since 1979 (2012 broke that record). This (2007) was the fall before the Rode & Regehr study on Chukchi/Southern Beaufort polar bears began (2008-2011). The ice was almost as low in September 2008 and 2010, while 2009 was more like 2013.

Figure 1. Sea ice extent at August 27, 2007 – the lowest extent that year (downloaded September 15, 2013 from IARC-JAXA, Arctic Sea-ice Monitor). At the time, it was the lowest extent recorded since 1979 (2012 broke that record). This (2007) was the fall before the Rode & Regehr study on Chukchi/Southern Beaufort polar bears began (2008-2011). The ice was almost as low in 2008 and 2010, while 2009 was more like 2013.

Continue reading

Ten out of ten polar bears being tracked this summer in the Beaufort Sea are on the ice

PB_male on ice_Regehr USFWS_March 2010_labeledTracking Beaufort Sea polar bears over the summer — what can it tell us about how important the position of summer sea ice relative to the shoreline in this region is to these bears? Do Beaufort Sea bears get stranded on shore like the polar bears in Davis Strait and Hudson Bay?

Polar bear biologist Eric Regehr (with the US Fish & Wildlife Service, or FWS) has a team working with US Geological Survey researchers (USGS) in the southern Beaufort tracking where adult female polar bears go throughout the year. This is part of on-going research in the Beaufort and Chukchi Sea (see previous post here; see also Fish & Wildlife 2009; Polar Bear News 2010 and 2013; Rode and Regehr 2010, pdfs below; and just out, the “accepted” version of the Rode et al. paper discussed here, and announced in my last post here).

The researchers have been posting a summary map at the end of each month on the USGS website showing the tracks of the females they fitted with radio collars the previous spring — for 2013, and back to 2010. They can’t put collars on male bears because their necks are larger around than their heads, so a collar would just slip off.

I’ve posted the July 2013 track map below, which shows all ten bears out on the ice, and the previous month (June 2013) to compare it to (the August map should be out shortly). I’ve included a few maps from 2012 to allow you to compare this year’s results to the situation last summer.

The August tracks should be available after the Labour Day weekend – check back next week to see where the bears have been this month. I’ll post the map here or you can go to the USGS website directly. [UPDATE Sept 4, 2013: The August map is up, posted here.]

Continue reading

Polar bears have not been harmed by sea ice declines in summer – the evidence

PB  logo colouredThe polar bear biologists and professional activists of the IUCN Polar Bear Specialist Group (PBSG) continue to insist that since 1979 increasingly smaller amounts of Arctic sea ice left at the end of summer (the September ice minimum) have already caused harm to polar bears. They contend that global warming due to CO2 from fossil fuels (“climate warming” in their lexicon) is the cause of this decline in summer ice.

In a recent (2012) paper published in the journal Global Change Biology (“Effects of climate warming on polar bears: a review of the evidence”), long-time Canadian PBSG  members Ian Stirling and Andrew Derocher (both of University of Alberta) summarized their position this way:

“Climate warming is causing unidirectional changes to annual patterns of sea ice distribution, structure, and freeze-up. We summarize evidence that documents how loss of sea ice, the primary habitat of polar bears (Ursus maritimus), negatively affects their long-term survival”

I’ve spent the last year examining their evidence of on-going harm, but in addition, I’ve looked at the evidence (much of it not mentioned in the Stirling and Derocher paper1) that polar bears have either not been harmed by less sea ice in summer or have thrived in spite of it.

This is a summary of my findings. I’ve provided links to my original essays on individual topics, which are fully referenced and illustrated. You are encouraged to consult them for complete details. This synopsis (pdf with links preserved, updated; pdf with links as footnotes, updated) complements and updates a previous summary, “Ten good reasons not to worry about polar bears” (pdf with links preserved; pdf with a foreword by Dr. Matt Ridley, with links as footnotes).

Update 8 September 2013: to include links to my post on the recently published Chukchi population report; updated pdfs have been added above.

Update 22 January 2014: added figure comparing March vs. September sea ice extent using the same scale, from NOAA’s “2014 Arctic Report Card,” discussed here.
Continue reading

Southern Hudson Bay subpopulation status, farthest south of all polar bears

“The Arctic” is a bit hard to define. While the Arctic Circle works as a good boundary for some purposes and the 100C isotherm for July for others, neither work for polar bears because several subpopulations live well south of these limits (Fig. 1).

In the east, Western Hudson Bay, Southern Hudson Bay and Davis Strait are all located well south of the Arctic Circle and the first two (and half of Davis Strait) are beyond the 100C July isotherm as well. In the western Arctic, the Chukchi Sea subpopulation is within the 100C July isotherm but at least half of its bears reside south of the Arctic Circle (Fig. 1) in the Bering Sea (see previous post here).

Unique amongst all of these is Southern Hudson Bay – all of its polar bears make maternity dens and/or spend the summer south of 600N.

Southern Hudson Bay (SH) bears live in the Canadian provinces of Ontario, while Western Hudson Bay (WH) bears reside in Manitoba and Nunavut. The two groups mix over the winter but appear to spend the summer/fall in their respective regions (Stirling et al. 2004). [See previous posts on Western Hudson Bay bears here, here, and here]

“Further south” in the Arctic usually means warmer, with open water present more weeks every summer, sea ice for fewer weeks over the winter. So, shouldn’t the bears of Southern Hudson Bay be already suffering more harm from global warming than virtually all other subpopulations, including those in Western Hudson Bay?

After all, Western Hudson Bay bears appear to have experienced a statistically significant decline in numbers, among other effects (Regehr et al. 2007; Stirling and Derocher 2012) — surely Southern Hudson Bay bears are doing worse?

You’d think so, but they aren’t.

Figure 1. Boundary limits for “the Arctic” (top map) such as the Arctic Circle (dashed line) or the 100C isotherm for July (solid red line) would not include several polar bear subpopulations that live south of these.

Figure 1. Boundary limits for “the Arctic” (top map) such as the Arctic Circle (dashed line) or the 100C isotherm for July (solid red line) would not include several polar bear subpopulations that live south of these.

UPDATED October 28, 2014: Reference added, Obbard et al. 2013 (aerial survey results).
Continue reading

Gulf of Boothia, unheralded Arctic utopia, has the highest density of polar bears worldwide

The issue of polar bear population density (# of bears per 1000 km2) came up a few posts ago, during my discussion of the new Davis Strait population study by Lily Peacock and colleagues (here). Since the various polar bear subpopulations across the Arctic are so different in size, calculating the density of bears in the various regions generates an interesting metric of how well the regional populations are doing relative to each other.

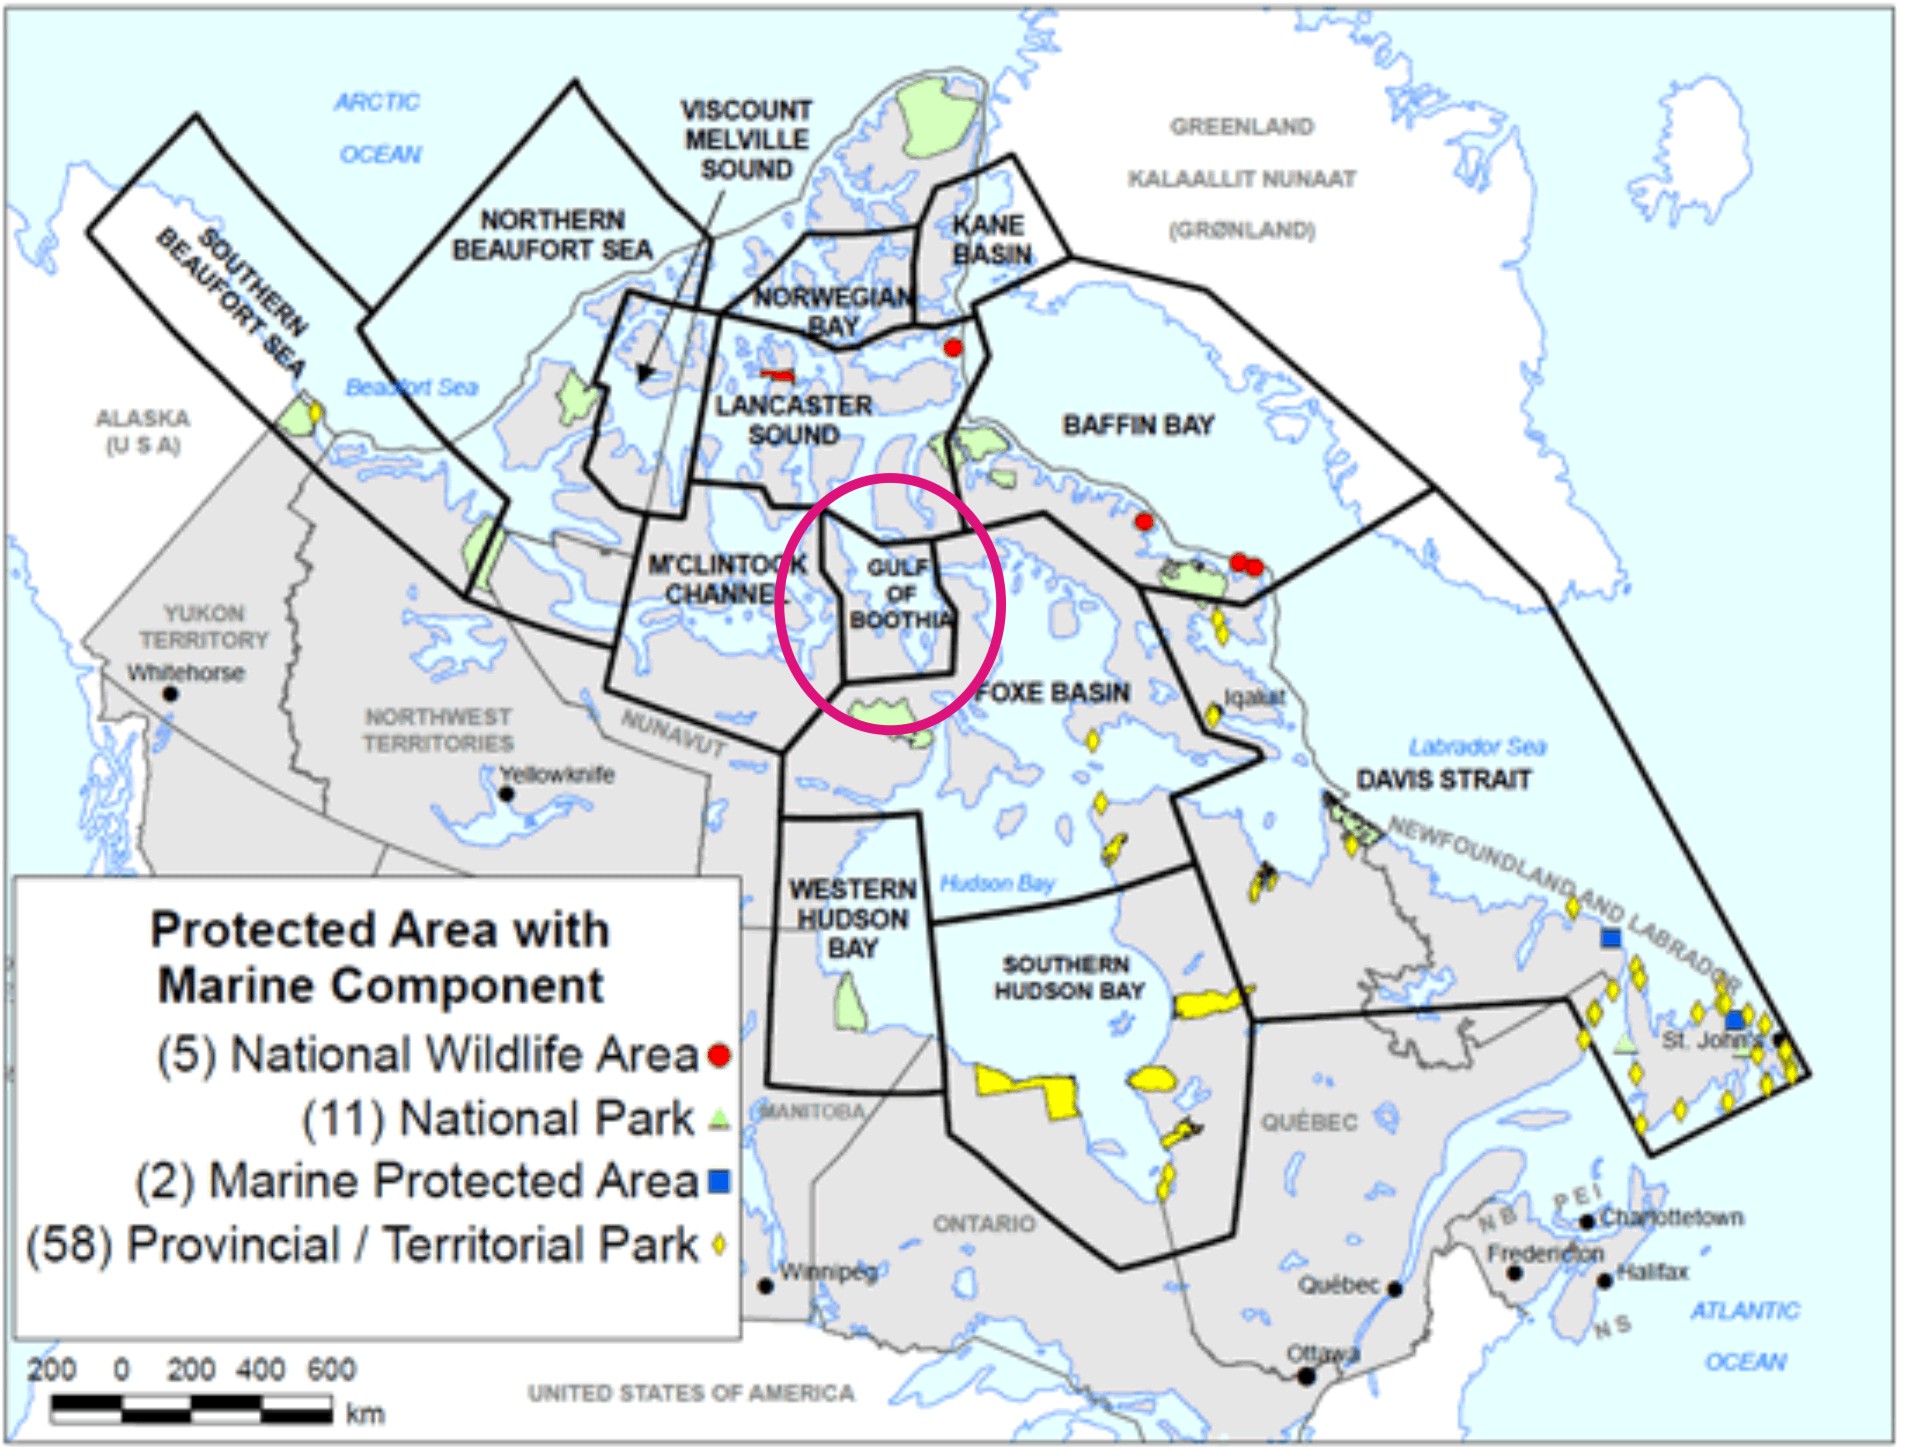
Almost 20 years ago, Taylor and Lee (1995) did just that: they determined the density of polar bears in the various Canadian subpopulations, as of the 1990s. Surprisingly, the ‘leader’ among those, by a wide margin, was one of the smallest in geographic area: the Gulf of Boothia. Located in the central Canadian Arctic (see Figs. 1 and 2 below), in the 1990s, tiny Gulf of Boothia supported a density of 10.4 polar bears per 1000 km2, the highest density of all regions examined.

 Figure 1. The Gulf of Boothia (circled) is right in the middle of the Canadian Arctic. In terms of geographic area, it is one of the smallest of all 19 subpopulations worldwide: at only 170,000 km2, only the Norwegian Bay and Kane Basin subpopulation regions, also in Canada (just to the north of Gulf of Boothia), are smaller at 150,000 and 155,000 km2 respectively (Vongraven and Peacock 2011). The Gulf of Boothia supports the highest density of polar bears known.Modified from map of polar bear protected areas provided by Environment Canada.


Figure 1. The Gulf of Boothia (circled) is right in the middle of the Canadian Arctic. In terms of geographic area, it is one of the smallest of all 19 subpopulations worldwide: at only 170,000 km2, only the Norwegian Bay and Kane Basin subpopulation regions, also in Canada (just to the north of Gulf of Boothia), are smaller at 150,000 and 155,000 km2 respectively (Vongraven and Peacock 2011). The Gulf of Boothia supports the highest density of polar bears known. Modified from the map of polar bear protected areas provided by Environment Canada.

But this density value for Gulf of Boothia was based on the 1986 population estimate of 900 bears – what is the most current figure?

For that, we need an updated population assessment. That was done in 2000 and it generated an estimate of 1,592 ± 361 bears (Taylor et al. 2009).

Taylor et al. (2009:791) said this about their assessment:

Our results suggest population size had increased steadily under a harvest regimen of approximately 40 bears/yrand added, “Barber and Iacozza (2004) found no trends in Gulf of Boothia sea ice conditions or ringed seal habitat suitability indices in the interval 1980-2000.

In other words, despite there being no trend in either sea ice conditions or habitat for seals – and a yearly harvest of 40 bears – polar bear numbers in the Gulf of Boothia increased significantly (by almost 700 bears) during the twenty years between 1980 and 2000. Even if the 1986 estimate of approximately 900 bears was somewhat less accurate than the more recent one, the fact that tiny Gulf of Boothia can support 1,592 bears is surely a remarkable feat.

Using this new population estimate and the same area of ‘available habitat’ used by Taylor and Lee in 1995, I calculated the most recent density at a spectacular 18.3 bears per 1000 km2! [note this is exactly what Peacock et al (2013) did to get their density value of 5.1 bears/1000 km2, discussed here.] But I didn’t update just Gulf of Boothia, I did them all.

The updated density values for Gulf of Boothia and several other Canadian subpopulations are listed in Table 1 below. Note that aside from Davis Strait, as far as I know these density figures have not been published elsewhere: you’re seeing them here for the first time.

Continue reading

Davis Strait polar bears again: body condition declined while population increased

This is a short follow-up to my last post on Davis Strait polar bears.

Today I’ll highlight a paper published last year (Rode et al. 2012) that had three of the same co-authors as the Peacock et al. (2012) paper I discussed on Monday – Lily Peacock, Mitch Taylor, and Ian Stirling contributed to both papers. Rode et al. (2012) deals with the issue of body condition (relative degree of fatness) in polar bears vs. changing levels of sea ice over time, and if you’ll pardon the pun, adds even more weight to the conclusion that declines in summer sea ice do not necessarily spell the disaster for polar bears we have been told is inevitable.

A polar bear near Thule, NW Greenland. Note the decidedly chubby back end on this bear, who looks well prepared for winter. Photo by Robin Davies. [details at my Quote Archive, Featured Quote #6]

A polar bear in the summer of 2012 near Thule, NW Greenland (part of the Baffin Bay subpopulation). Note the decidedly chubby back end on this bear, who looks well prepared for winter. Photo by Robin Davies.
[details at my Quote Archive, Featured Quote #6]

Continue reading