Tag Archives: NSIDC

Natural selection helps polar bears adapt to sea ice variability – which means some bears die

Evolution is not just for the long-term – natural selection also goes on over short time periods. In the case of polar bears, this adaptation is almost certainly critical for its long-term survival.

Hudson Bay female with cub_Wapusk_Thorsten Milse_Gov CA

Hudson Bay female with cub Wapusk National Park, Thorsten Milse, Government of Canada

Not all polar bears are identical — that is the reality that allows natural selection to operate.

I will argue that early breakup years in Western Hudson Bay weed out individual polar bears that do not have the physiological or behavioral characteristics necessary to be useful members of the population – and that this is a good thing for the entire population.

Continue reading

Ian Stirling now says the polar bear that “died of climate change” last year was “in his prime”

With Barents Sea ice way above average this summer, Polar Bear Specialist Group biologist Ian Stirling now claims the old polar bear that he said died of climate change last year on Svalbard was “in his prime” and still blames the bear’s death on lack of sea ice — despite all evidence to the contrary.

UPDATE Sept. 19, 2014 typo fixed in Fig. 1 caption [sea ice low for 2012 was 3.41 m2km, not 4.1, see here.]

Figure 1. The National Snow and Ice Data Center (NSIDC) says the September minimum for 2014 is “imminent” and suggests the low may come in at 5.1 million square kilometers (far short of the 4.1 m2km low reached in 2012. About the much larger than average amount of ice around Svalbard and Franz Josef Land, they said only: “As was the case for the beginning of the month, extent remains below average in all sectors of the Arctic except for a region in the Barents Sea, east of Svalbard.”

Figure 1. The National Snow and Ice Data Center (NSIDC) says the September minimum for 2014 is “imminent” and suggests the low may come in at 5.1 million square kilometers (far short of the 4.1 3.41 m2km low reached in 2012. About the much larger than average amount of ice around Svalbard and Franz Josef Land, they said only: “As was the case for the beginning of the month, extent remains below average in all sectors of the Arctic except for a region in the Barents Sea, east of Svalbard.”

Continue reading

M’Clintock polar bear survey’s first year plagued by fog in an area thick with heavy ice

“Blizzards, we had fog — we had to sleep in the helicopter, on the sea ice one night, because we couldn’t fly anywhere,” Markus Dyck, senior polar bear biologist with the GN, told Nunatsiaq News Sept. 5.”

Polar bear with dart_bear_570_2012 Kane Basin_M Dyck photo

Fog was the theme of polar bear research this summer in Queen Maud Gulf, otherwise known as the M’Clintock Channel polar bear subpopulation region.

The ice has been heavy in that region as well, according to a the National Snow and Ice Data Center (NSIDC) and reported yesterday in another story (Heavy pack ice in NW Passage ice creates tough conditions this year: Pack ice clogs Queen Maud Gulf).

For maps showing where M’Clintock Channel and Queen Maud Gulf actually are, see the maps — and more quotes — below.
Continue reading

Summer sea ice melt and polar bear maternity dens

The yearly sea ice minimum extent is almost upon us, which has recently been the seasonal signal for excitable biologists and their activist groupies to resume their breathless rants about what sea ice loss could mean for polar bears.

Polar bear den_CreditUSFWS_labeled

Never mind that the summer minimum extent reached in September, no matter how low it goes, is pretty much irrelevant to polar bear health and survival. As I’ve discussed before, what’s really important is the presence of not-too-thick ice during the spring, so they can catch lots of young seals and put on lots of fat.

But to a lesser degree, the extent at mid-to-late summer is important because this is when pregnant females that prefer to make their maternity dens on shore are looking for good places to spend the winter.

So the topic for today is this: how much does the extent of ice at the height of summer dictate where polar bear females make their winter dens?
Continue reading

Current ice conditions don’t bode well for Beaufort Sea polar bears

Thick spring ice along the shore of the Eastern and Southern Beaufort is bad news for polar bears, especially females emerging from their dens with new cubs. Are those conditions developing now?

Beaufort Sea pressure ridges_Spring 1949 wikipedia sm

Every 10 years or so, since at least the 1960s, nearshore ice gets too thick for ringed seals to maintain their breathing holes and many breeding seals depart the area. This leaves a lot of polar bears without the baby seals they need to consume to get them through the rest of the year (that’s if they don’t (or can’t) leave themselves).

I’ve discussed various aspects of this phenomenon before, with references – see the list at the end of this post.

Sadly, we are on schedule for such conditions to recur – could be this year, could be next. The last time of heavy spring ice was 2004 and previous heavy ice conditions occurred the springs of 1964, 1974 (the worst), 1984, 1992 and 2004. The 2004-2006 event was reportedly almost as bad as the 1974-1976 event.

So, prompted by reports of the heaviest sea ice conditions on the East Coast “in decades” and news that ice on the Great Lakes is, for mid-April, the worst it’s been since records began, I took a close look at ice thickness charts for the Arctic. I’m not suggesting these conditions are necessarily related to Beaufort ice, just that they got me thinking.

Here’s a screencap of the US Navy ice thickness animation chart for yesterday [from WUWT Sea Ice Page]

Figure 1. Arctic Sea Ice Thickness (NRL), for April 18, 2014. Look at thick ice (yellow, 3.5-4.0 meters thick) spreading along the north coast of Alaska. See the 30 day animation here.

Figure 1. Arctic Sea Ice Thickness (NRL), for April 18, 2014. Look at thick ice (yellow, 3.5-4.0 meters thick) spreading along the north coast of Alaska. See the 30 day animation here.

Below is a similar image from about the same time last year, with the Southeast Beaufort Sea marked.

Figure 2. Arctic Sea Ice Thickness (NRL), for April 13, 2013. Southeastern Beaufort marked.

Figure 2. Arctic Sea Ice Thickness (NRL), for April 13, 2013. Southeastern Beaufort marked.

I don’t think this bodes well for Beaufort bears but we’ll have to wait and see if there are any reports of starving bears bit later this spring and summer. Sea ice charts aren’t a guarantee that this heavy spring ice phenomenon is developing in the Beaufort, but they could be a warning.

Below are archived ice age charts from the US National Snow and Ice Data Center (NSIDC) for some previous years when Beaufort bears had trouble, especially 2004-2006, with which I compare this year’s conditions. [h/t Steve Goddard for alerting me to this resource]

Continue reading

Davis Strait polar bear habitat higher now than in 1979 and early 1980s

The Davis Strait polar bear subpopulation is said to be ‘vulnerable’ to the supposed effects of global warming because, like Hudson Bay, Davis Strait sea ice retreats every summer, leaving polar bears on land for several months.

However, Davis Strait bears have been upgraded to ‘stable’ status, according to the latest table (2013) issued by the IUCN Polar Bear Specialist Group (see their boundary map for Davis Strait bears below). Recent development of sea ice in the region can only improve that rating.

[More background here and heremap-DavisStrait

It seems that sea ice in Davis Strait is well above normal for this time of year – a recent announcement by the Canadian Ice Service (CIS) says it’s 10% above average, higher than it’s been in 25 years (h/t S. Goddard).

The Canadian Ice Service, an arm of Environment Canada, said there is 10 per cent more ice this year compared to the 30-year average.

We probably haven’t seen a winter this bad as far as ice for the past 25 years,” said Voight, referring to both the amount and thickness of the ice.

He said the Gulf of St. Lawrence is covered and some areas are “quite severe.” [my bold]

Full story here.

Latest ice map (March 12) below from the US National Snow and Ice Data Service (NSIDC).

As I pointed out recently here, Barents Sea ice is below average this year, largely due to natural variation in the Atlantic Multidecal Oscillation (AMO), but is higher over the western Atlantic (Sea of Okhotsk ice is below average too but there are no polar bears there).

There is lots of ice around Labrador and Newfoundland, however.

Sea ice extent 2014 March 12 NSIDC

I thought I let you see exactly what CIS are talking about: what did the ice look like 25 years ago, in 1989? What about 35 years ago, in 1979, the start of the satellite record for sea ice? It might surprise you. Continue reading

Barents Sea polar bear condition varies with AMO and spring sea ice conditions

Fig. 1. NSIDC sea ice extent at March 8, 2014 (a "MASIE" product), with labels added. Click to enlarge.

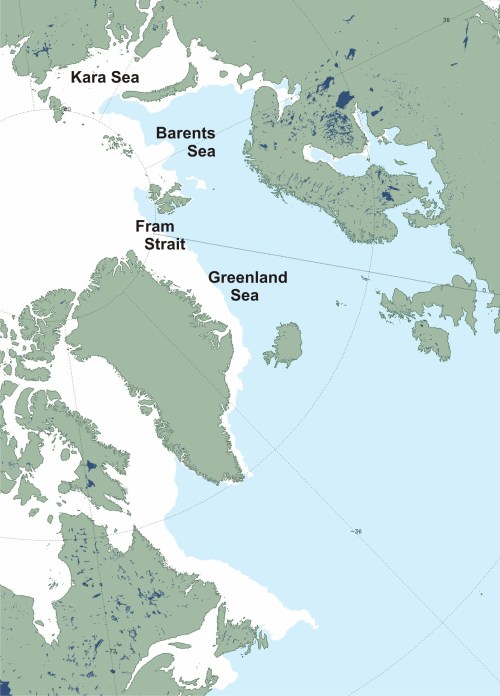
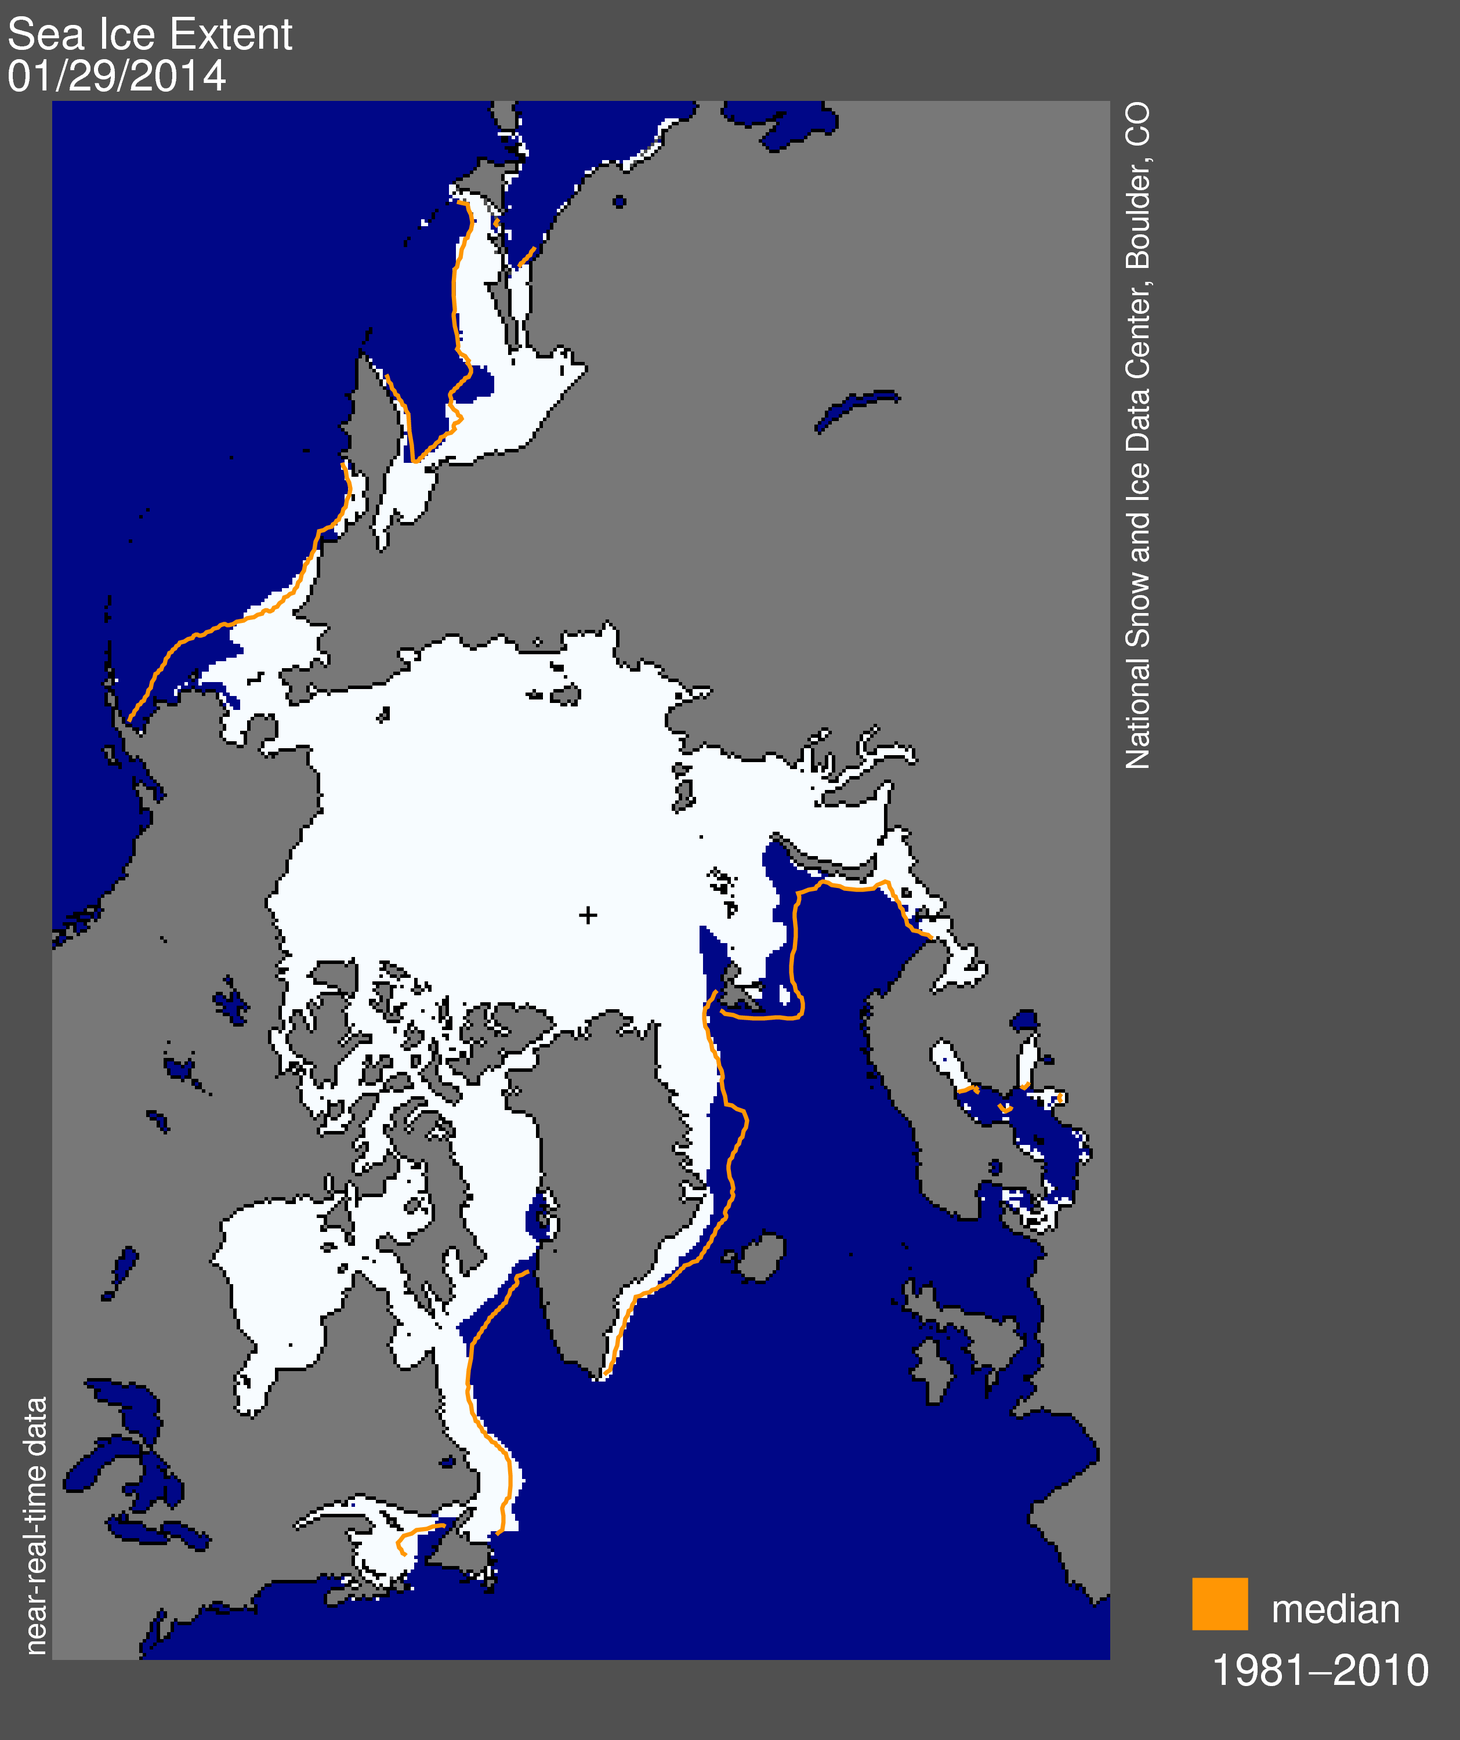
Figure 1. NSIDC sea ice extent at March 8, 2014 (a “MASIE” product), with labels added. Click to enlarge.

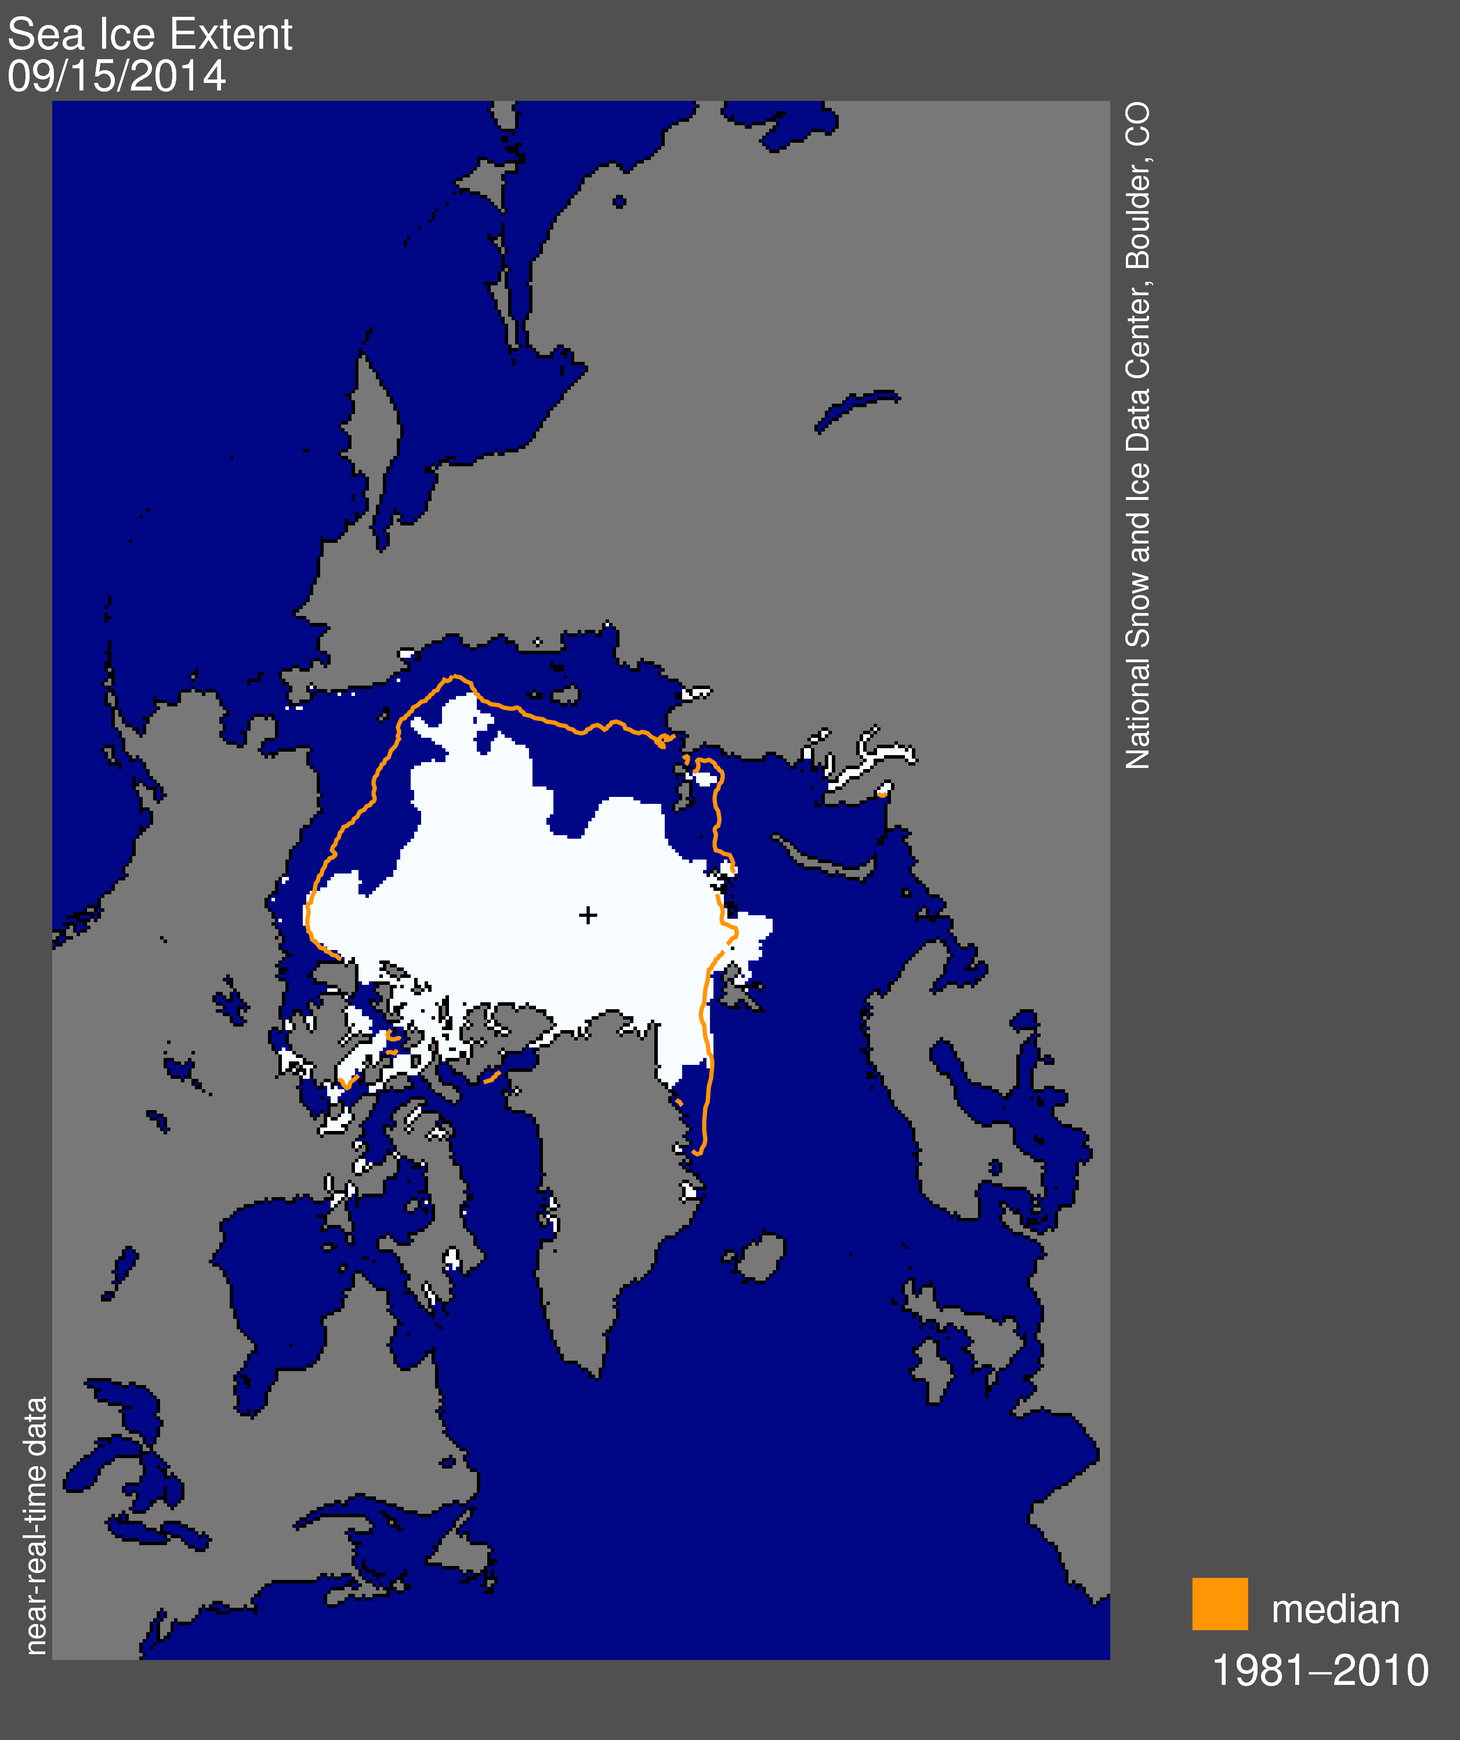
In its end of February report, the US National Snow and Ice Data Center (NSIDC) noted that Barents Sea ice was below average for this time of year (see Fig. 1 above, and Fig. 5 below) but suggested this was primarily due to natural variation driven by the Atlantic Multidecadal Oscillation (AMO):

“The Barents Sea has experienced consistently low extents, particularly in winter, and this year has been no different. While the Barents and Kara seas normally have close to 2 million square kilometers (772,000 square miles) of ice in February, recent years have seen 500,000 square kilometers (193,000 square miles) of ice extent or lower. This year, the Kara Sea is near average, but the Barents Sea remains low (Figure 4a). Unlike other regions in the Arctic, longer records of Barents Sea ice extent exist from records of fishing, whaling, and other activities. A recent paper (Miles et al., 2013 [2014, now in print]) examined these records, along with paleoproxy data, to examine extent over the past four hundred years. They found a 60- to 90-year cycle in Barents and Greenland seas ice extent related to the Atlantic Multidecadal Oscillation (AMO); the AMO is a basin-wide cycle of sea surface temperature variability similar to the El Niño and La Niña cycles in the Pacific, but varying over much longer periods. This research shows that in addition to the warming trend in the Arctic, some sea ice regions are likely also responding to natural climate variability.” [my bold]

The paper they cite (Miles et al. 2014, discussed elsewhere in December 2013 here) described the AMO this way:

“The AMO is a coherent pattern of basin-wide sea surface temperature (SST) variations with a period of roughly 60–90 years. ..Paleoenvironmental studies suggest that the AMO has persisted through previous centuries [Gray et al., 2004] and even millennia [Knudsen et al., 2011].”

Note that Miles and colleagues were looking at ice records on or around the sea ice maximum in winter/spring.

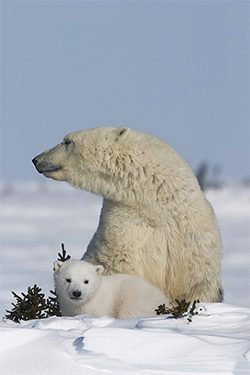
The Polar Bear Twist: Norwegian biologists Jon Aars and Magnus Andersen, who I’ve discussed before, have pointed out that the condition of polar bear males and females around Svalbard (Fig. 2) they examined over the last 20 years varied with the AMO and sea ice levels in spring and early summer. [research results posted at the website for Environmental Monitoring of Svalbard and Jan Mayen (MOSJ), Norwegian Polar Institute].

Figure 1. The Barents Sea polar bear subpopulation, courtesy the IUCN Polar Bear Specialist Group. "Svalbard" is the largest archipelago, in the eastern portion.

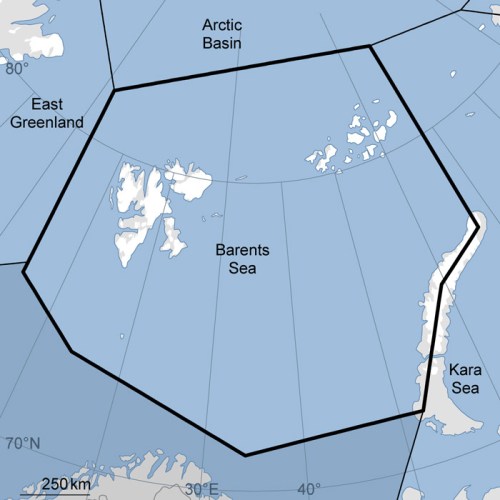
Figure 2. The Barents Sea polar bear subpopulation boundaries, courtesy the IUCN Polar Bear Specialist Group. Svalbard is the largest archipelago, closest to the East Greenland Sea.

That makes a lot of sense to me, given that spring/early summer is the most critical feeding season for polar bears because it’s when fat young seals are most easily available.

It also makes sense to me that you may need a record hundreds of years long to understand the natural variability of Arctic Sea ice in its various regions. Recall that natural variation, not global warming, is now being used to explain the large variation in annual sea ice cover in the Bering Sea (home to Chukchi Sea polar bears). Continue reading

Polar bear habitat update – January 2014

Sea ice in the Arctic a bit below the 1981-2010 average for this date  but still within two standard deviations, with more ice than average off Canada — indicating we are still within expected natural variation, statistically speaking.

Remember that the National Snow and Ice Data Center (NSIDC) says this about standard deviation:

“Measurements that fall far outside of the two standard deviation range or consistently fall outside that range suggest that something unusual is occurring that can’t be explained by normal processes.”

Ice maps below, click to enlarge.

 Figure 1. Sea ice and lake ice concentration from the Canadian Ice Service (CIS) for 31 January, 2014. Note the amount of ice in the east, off Labrador (the “Davis Strait” polar bear subpopulation).


Figure 1. Sea ice and lake ice concentration from the Canadian Ice Service (CIS) for 31 January, 2014. Note the amount of ice in the east, off Labrador (the “Davis Strait” polar bear subpopulation).

Figure 2. Sea ice extent from the National Snow and Ice Data Center (NSIDC) for 29 January 2014. Note that the extent of ice in eastern Canada noted in Fig. 1 is slightly more than the 1981-2010 average (the orange line), while other areas have slightly less than average for this date. Compare ice growth over the last month to Fig. 3 below.

Figure 2. Sea ice extent from the National Snow and Ice Data Center (NSIDC) for 29 January 2014. Note that the extent of ice in eastern Canada noted in Fig. 1 is slightly more than the 1981-2010 average (the orange line), while other areas have slightly less than average for this date. Compare ice growth over the last month to Fig. 3 below.

Continue reading

Polar bear problems in N Hudson Bay not due to late freeze-up

The myth that northern Hudson Bay communities are having problems with polar bears this year because freeze-up is later than usual just won’t go away.

I discussed the well publicized craziness in Churchill last week (here and here), but there’s more. Polar bears are already leaving the shore of Northern Hudson Bay as the ice rapidly forms but I saw a story yesterday (dated late last week) that quoted a local official in Repulse Bay blaming their polar bear problems on late freeze-up.

I’ve written before about the peer-reviewed paper by polar bear researchers Seth Cherry and colleagues published earlier this year on breakup and freeze-up dates between 1991 and 2009. But perhaps the freeze-up data needs more emphasis. I’ve copied that graph again below, with notes, and added some ice maps. See for yourself.

Bottom line: A “late freeze-up” for northwestern Hudson Bay occurs when ice formation is delayed until early December or beyond. Freeze-up was nowhere near “late” this year, nor was the ice “slow to freeze.” It wasn’t last year either.
Continue reading

September sea ice ballyhoo and why it doesn’t matter to polar bears

The end of September sea ice summary from the US National Snow and Ice Data Center (NSIDC) finally became available late last week (October 3, “A better year for the cryosphere”).

The summary figure NSIDC provides are the average ice extent for the month (not the maximum achieved at the end of the month), which are compared to previous years.

[There has been considerable ice growth since the end of September (updated daily here].

Here is why the September extent doesn’t matter to polar bears: it is the extent in June that is important to polar bear survival. June is the end of the critical spring feeding period for polar bears (see previous post here) – healthy bears eat more seals over a shorter period of time from March to June than any other time of year. After the end of June, most bears have enough fat to survive a fast of 4 months or more.

In contrast to September – when many bears are taking a time-out on shore – ice extent for June over the last 30 years or so provided an extensive hunting platform for polar bears throughout the Arctic. To show you how extensive, I’ve constructed a composite of ice maps from selected years (Fig.1, below).

Continue reading