Tag Archives: freeze-up

W. Hudson Bay had 1030 polar bears at last count and that is the official number

The IUCN Polar Bear Specialist Group, the IUCN Red List, and Environment Canada (see below) agree that the population size of Western Hudson Bay subpopulation is 1030 or about 1000 bears, based on surveys conducted in 2011.

western-hudson-bay-surveys-2011-compared_polarbearscience-16-dec-2016

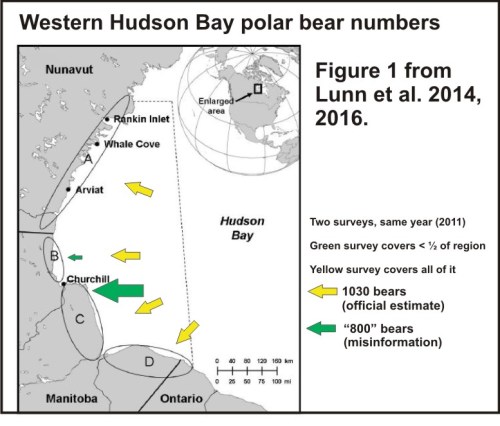
For the last few months (most recently, here and here), Andrew Derocher has been telling anyone who will listen that that the number is 800. And no one challenges him – not a single reporter asks where the number comes from, not a single research colleague who knows the truth has publicly stated that Derocher is spreading misinformation.

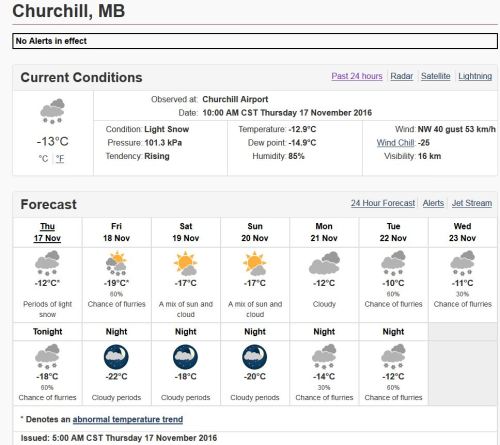
UPDATE 16 December 2016, half an hour after posting: Add The Atlantic to those accepting Derocher’s misinformation on WHB polar bear numbers without question, and failing to see that because patrols in Churchill were stepped up considerably after a serious mauling occurred in 2013 (because several bears got through their Halloween dragnet), more “problem” bears in Churchill since then only mean the Polar Bear Alert folks are doing their jobs.

But what does The Atlantic conclude, after talking to Derocher?
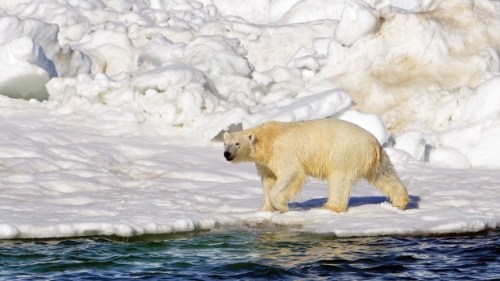
The Churchill bears…are probably doomed.

Never was a rational book on the science and conservation status of polar bears more desperately needed – it will be available soon.
Continue reading

An El Niño year late start to freeze-up on Hudson Bay: bears gearing up to hunt

There is no serious ice on the west shore of Hudson Bay yet (as the map below shows) but the winds have just shifted – instead of coming from the south, they are now blowing in from the north.

Freeze-up and a resumption of seal hunting for Western and Southern Hudson Bay polar bears looks imminent. The bears get out on the ice as soon as they are physically able, when the ice is about 3-4 inches thick (about 10 cm).

sea-ice-extent-canada-2016-dec-5_cis

I’m going to let Kelsey Eliasson from PolarBearAlley, on shore at Churchill, convey the gist of the freeze-up situation on the Bay.

Recall that freeze-up was late in both 1998 and 1999 – during the height of that strong El Niño warmth as well as the year following. Continue reading

No correlation between freeze-up dates for WHB sea ice & Churchill temperatures

This is a follow-up to my last post and this time, I’ll address the implied correlation between freeze-up dates for Hudson Bay and Churchill temperatures in November that is being made by folks who should know better .

polar-bear-tests-thin-ice_mario-hoppmann_noaa-funded-imaggeo-egu-eu

Monday, 14 November 2016 a.m, over at Polar Bears International [my bold]:

“As a new week starts in Churchill, the weather is the warmest we’ve ever seen at this time of year. The tundra is muddy, with remnant patches of snow, and the bay is ice-free.” PBI Blog (no author designated)

Well, that may be true for the last few years – the high on 14 November 2016 (-1.20C) was the highest since 2012.

Andrew Derocher made a similar statement on the 4th (my bold):

There’s no sea ice anywhere in Hudson Bay yet—not even in the northern part of the Bay where ice should be forming. It’s above freezing today and if the forecast holds, it will be a record high for this date. It was 10 degrees colder last year at this time.”

Derocher is being unscientifically vague here and also misleadingly cites highs and lows as if they were the same. In fact, according to weather records kept by Environment Canada, for 4 November 2016 at Churchill, the daily high was +1.50C (compared to –1.50C in 2015). The daily low in 2015 was -15.30C, a 10 degree difference. The next-highest temp. for that date since 2012 was +0.70C in 2014 – hardly an earth-shattering difference.

However, if you are trying to draw conclusions about climate, you should go back at least 60 years (two climate periods of 30 years each). Temperature records for Churchill go back to 1943, which can be used to assess the claim for the 14th of November made by PBI.

According to weather records kept by Environment Canada, for 14 November at Churchill, the year with the highest temperature was 1975 (+2.20C):

churchill-weather-averages-and-extremes-2016-ec-14-nov

That was Monday. But as of yesterday, the weather recorded – and the forecast for the following week (17-23 November) was quite different, as the screencap below shows:

churchill-weather-2016-abnormal-cold-17-23-nov

The final recorded max. for yesterday (Thurs. 17 Nov) was -9.70C vs. a min. of -17.70C. So, a bit warmer during the day than predicted but as cold as expected overnight.

And for today, the current temperature in Churchill, as I write this is, is -190C (-310C with the wind chill) and the year with the highest temperature recorded for 18 November was 1944 (0.00C) – which was also the highest temperature for the 19th, recorded in 1943.

Ice maps and historical background below. See last post for recent multi-year comparison.
Continue reading

No correlation between freeze-up dates for Hudson Bay & total Arctic ice cover

Guess which year between 2006 and 2016 had the latest start to freeze-up on Hudson Bay, given that 2012 had the lowest September average and 2007 and 2016 tied for second-lowest (see graph below, from NSIDC), and that sea ice in the Arctic right now is the lowest it’s been for this date since 1979?

sea-ice-sept-averages-graph-only-marked-for-2006-up

If you guessed anything other than 2010, you guessed wrong – in addition, 2006 (not 2016) was second latest.

There is no correlation between Arctic sea ice coverage and freeze-up dates for Western Hudson Bay.

Yet, Polar Bears International (“Save Our Sea Ice”) –  who were surely in and around Churchill in 2010 and 2006 watching polar bears – just posted an alarming statement about local conditions, implying that slow freeze-up of Hudson Bay this year is a reflection of the fact that “sea ice is at a record low across the Arctic.”

They also claim that “…the weather is the warmest we’ve ever seen at this time of year.” That may be true, but if so, it is also meaningless with respect to the progress of freeze-up.

Does no one at PBI remember the very late freeze-up of 2010 or 2006? Odd, that.

Continue reading

Ice formation in W Hudson Bay slower than 2015 but not likely as slow as 1983

After a great start this year for Churchill-area polar bears of Western Hudson Bay – who came off the ice in better than usual condition after what must have been a good spring hunting season – ice maps suggest that freeze-up will be later than last year, an impression confirmed by on-the-ground observers.

Ice coverage this year at 7 November (2016):

sea-ice-extent-canada-2016-nov-7_cis

Ice coverage last year at this date (7 November 2015), see this post for details:

UPDATED 23 November 2021: see below.
Continue reading

Tracking west Alaskan polar bears in the Beaufort in October – all at Banks Is., CAN

polar-bear-habitat_usgs-from-cbc-story-sept-19-2015

Two out of three polar bear females that were collared by USGS researchers near Barrow, Alaska last spring are hanging out on the northwest coast of Banks Island, Canada. The other bear (bright green icon) appears to have been collared on the ice off Prudoe Bay in April. And as I discussed last month, it’s unusual for bears from the western end of the Southern Beaufort subpopulation (or even the central region) to end up in the Northern Beaufort subpopulation territory.

beaufort-tracking-usgs-bear-movements-october-2016-sm

Original caption: “Movements of 3 satellite-tagged polar bears for the month of October, 2016. Polar bears were tagged in 2016 on the spring-time sea ice of the southern Beaufort Sea. All 3 of these bears have satellite collar transmitters. Polar bear satellite telemetry data are shown with AMSR2 remotely-sensed ice coverage from 29 October, 2016.” See full resolution image here and close-up below.

Continue reading

Polar bear habitat this fall shaping up fast – more like 2010 than 2007

Arctic sea ice tied 2007 for extent at the September minimum less than 3 weeks ago but with the refreeze proceeding much faster than 2007, seals will soon be returning to the ice edge and polar bears will be back to feeding like they did in 2010.

sea-ice-at-28-sept_2016_vs-2007_2012_5-point-0_nsidc-interactive

Sea ice extent less than 5.0 mkm2 lasted less than 6 weeks (23 August – 28 September), according to NSIDC.

Continue reading

Condition of S Hudson Bay polar bears varies with freeze-up only says new study

Despite the fact that the polar bears of Southern Hudson Bay (SHB) live further south year round than any others, a recent study found their average body weight has declined relatively little since the 1980s. There has been no decline in the size of the population over that time either. Perhaps that’s why there was neither a press release nor a massive media blitz when this paper came out earlier this month.

James Bay female and cub_Ontaro Govt

Remarkably – despite what we are told about how critical breakup dates are to polar bear health and survival in Hudson Bay – this study found that for SHB bears, the small decline in body condition index correlated only with freeze-up dates, not breakup dates or length of the ice-free season. They also found that regional breakup and freeze-up dates relevant to polar bears in this area was the day when ice cover reached 5% (not 50%).

In other words, SHB polar bears left the ice (or returned to it) when the average ice  cover near the coast was about 5%. This finding is yet more evidence that the meteorological definition of “breakup” (date of 50% ice cover) used by many researchers (see discussion here) is not appropriate for describing the seasonal movements of polar bears on and off shore.

Continue reading

Polar bear myths perpetuate from the mouth of stuck-in-the-past Ian Stirling

In my last post, I complained about “vague and misleading statements” made by polar bear specialists and conservation advocates. Here’s a recent example of that phenomena, from veteran polar bear biologist Ian Stirling.


stirling_UA faculty page photo accessed July 22 2012

The magazine of Canada’s North, UpHere, published an interview with Ian Stirling this month. The piece begins:

“No fear-mongering. No exaggeration. For Ian Stirling, it’s purely about the science.”

Yeah, well – judge for yourself. Here’s a sample:

“We have lost on average about half the sea ice that we had in 1979, which is the first year that satellite coverage of the Arctic was taken [he’s talking about September ice here]. Places like Hudson Bay are breaking up three weeks earlier than they used to and freezing up a couple weeks later. We’re going to have even more significant effects over a much wider area in the Arctic. We’re likely to lose another 30 or 40 percent, or even half of the bears that we have today in the middle of the century, and unchecked, we will likely have very few bears left at the turn of the next century. In 2100, we’ll probably just have a few small remaining pockets in the northern Canadian Arctic islands and northern Greenland.”

Read the rest here.

Stirling’s opinion about polar bears and climate change hasn’t changed since at least 2004 despite the following scientific developments: Continue reading

Hudson Strait and Davis Strait polar bear habitat highest since 1993

Sea ice development over Hudson Bay, Hudson Strait, and Davis Strait has been rather unusual this year but what that might mean for polar bears over the coming winter and spring is hard to tell.

Canadian Arctic Dec 11 2015_CIS

Note: The Canadian Ice Service seems to be in the process of updating its sea ice page and graphing features that used to be available weekly on Thursday have not been available until the following week. This means the most recent graphs available are for the week of 11 December (see below).
Continue reading