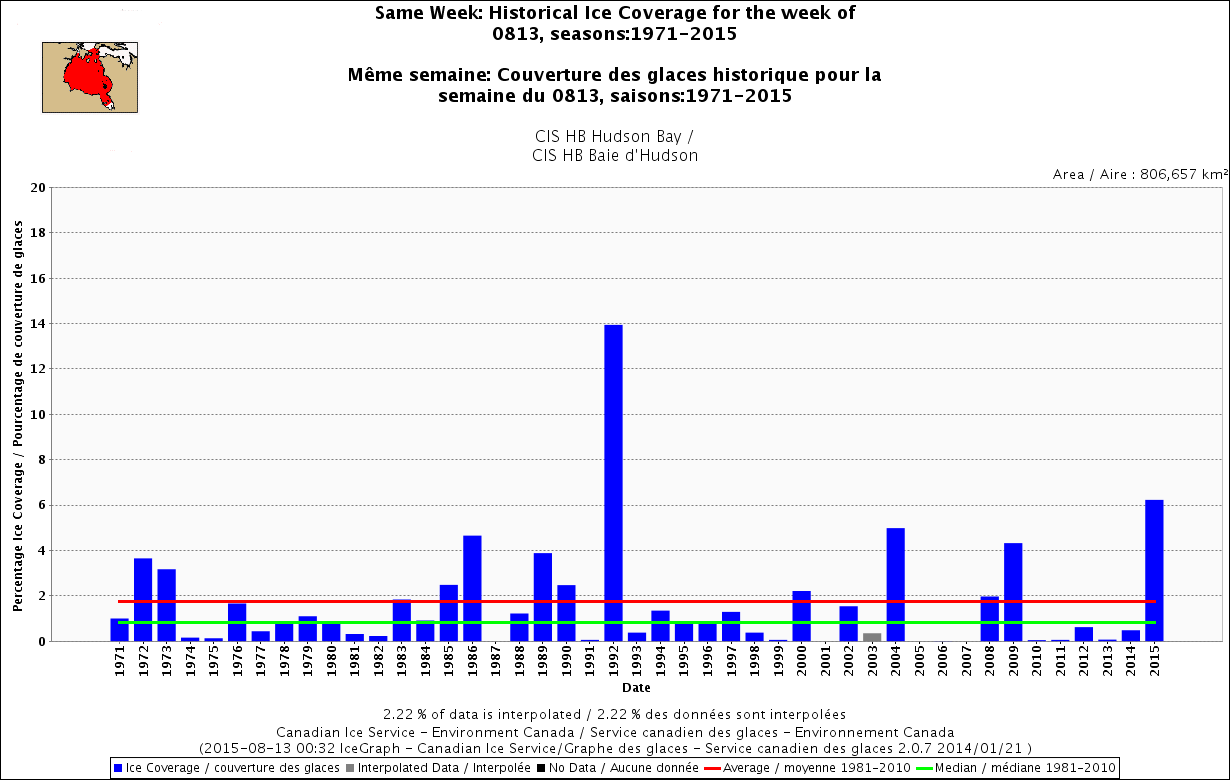
Posted onAugust 13, 2015|Comments Off on 2nd highest ice coverage for Hudson Bay since 1971 at mid-August – only 1992 higher
Since 1971, there has been no year when there was as much ice left on Hudson Bay as there is this year at August 13th, except 1992 – the year when Mt. Pinatubo seemingly affected Hudson Bay ice levels but not any other region in Eastern Canada or the Beaufort Sea. Odd, that – see the graphs below.
Doesn’t mean that much to polar bears, since they will mostly be fasting whether they are onshore for the summer or riding the ice – they primarily live off their fat this time of year. Still, the relative ice levels are interesting because it could impact freeze-up dates later this fall, which will influence the bears’ ability to hunt before the winter fast sets in.
Posted onAugust 12, 2015|Comments Off on Hudson Bay ice update – researchers awfully quiet about what polar bears are doing
This year 225 thousand km2 of sea ice remained on Hudson Bay at 10 August compared to 96 thousand km2 in 2009, the last late breakup year for which there are detailed ice maps and polar bear data.
In 2009, most Western Hudson Bay polar bears were onshore by 22 August, just after the very last remnants of ice disappeared (see map below). This year? The remaining ice is further east, in Southern Hudson Bay territory. Last report from a few weeks ago showed some Southern Hudson Bay bears came ashore early but past behavior suggests some bears will wait until the bitter end before they come ashore – until the very last remnants of ice disappear (Cherry et al. 2013). Continue reading
Comments Off on Hudson Bay ice update – researchers awfully quiet about what polar bears are doing
Posted onAugust 9, 2015|Comments Off on Summer polar bear habitat then & now – little impact from 2007 record-breaking sea ice low
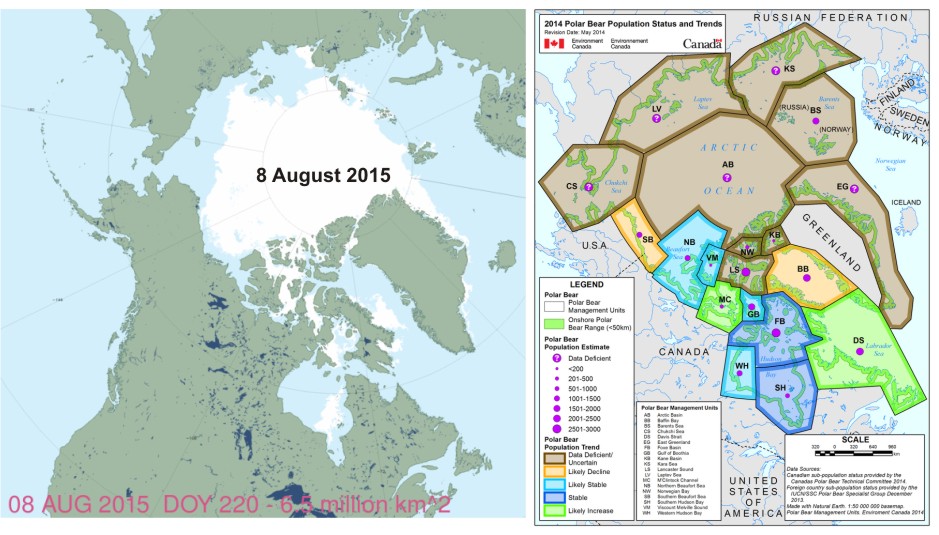
Sea ice looks low for this time of year but how does it compare to 2007, when summer ice habitat for polar bears hit a record-breaking low? What can the impact of 2007 ice levels on polar bears tell us about what to expect this year?
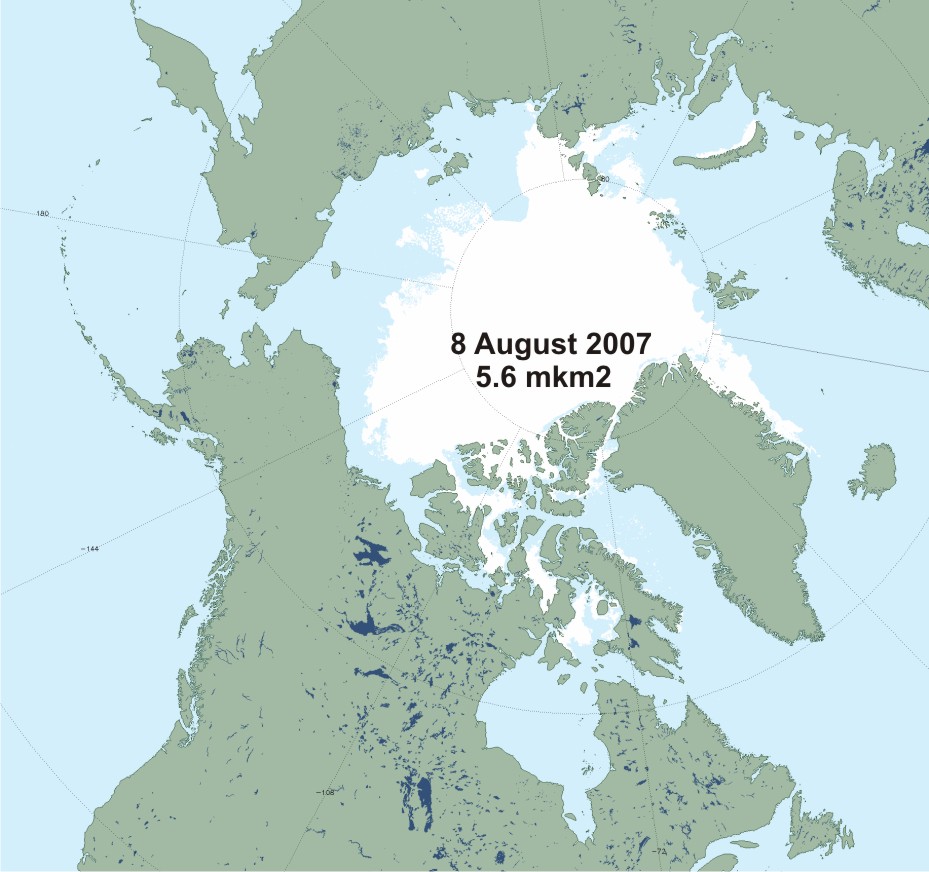
By this date in 2007 (8 August, Day 220, NSIDC Masie map below), there was almost 1 million km2 less ice than there is this year (map above). However, look which polar bear subpopulations not only survived, but thrived, through the 2007 low ice summer: Chukchi Sea, Southern Beaufort, Barents Sea, Davis Strait, Foxe Basin, Western Hudson Bay, and Southern Hudson Bay. That’s all of the subpopulations for which we have recent data.
There is more than a month left in the melt season, of course. However, while 2012 finished with a lower minimum ice extent due to a massive mid-August storm that broke up a lot of ice (Simmonds and Rudeva 2012), by the end of the first week of August (i.e, the 8th), there was more ice in 2012 than in 2007 and a bit less than this year (2012, 6.3 mkm2; 2007, 5.6 mkm2; 2015, 6.5 mkm2).
This means if less summer ice for a longer period of time impacts polar bear health and survival, conditions in 2007 should have had a noticeable impact on polar bears around the world. They didn’t. That suggests even if this September sea ice minimum is as low as 2007, it won’t have any negative impact on polar bear health or survival. The most profoundly negative documented impacts have come from thick sea ice in spring or suboptimal spring snow levels (Crockford 2015) and the evidence shows that variation in the extent of summer ice is simply irrelevant to polar bears.
Posted onAugust 6, 2015|Comments Off on Pacific walrus sob stories begin again
Now we have poor hunting conditions in the Bering Strait touted as evidence that “walrus migration patterns have changed” with the implication that this is because “…the past eight years have had the eight lowest amounts of summer sea ice on record” due to man-made global warming.
A subsistence lifestyle is hard, particularly so if it depends on a highly mobile, migratory herd animal. Think Barren-ground Inuit caribou hunters, who often starved because herd sizes declined for a few years or moved unpredictably.
Many factors – seasonal weather, last year’s winter conditions, size of the herd, food supply – all affect where and when a migratory herd will move and the likelihood it will be positioned for optimal harvesting by hunters. Add another highly variable factor into that – Bering Sea ice – and you have a highly unpredictable food supply, especially if you sit in one spot (like on St. Lawrence Island) and expect that migratory herd animal to come within reach.
Hunting walrus from St. Lawrence Island depends on just the right combination of ice and winds. Too much ice is not good, too much open water is not good, and too much wind is not good.
Alaska Dispatch, courtesy the Associated Press, reports St. Lawrence natives are again short of walrus meat because of “warm temperatures”: “Warming temps push walrus north, leaving Alaska villages without traditional food source”(Rachel D’Oro, The Associated Press, August 6, 2015). And the caption of the above USGS (A. Sonsthagen) photo predictably implies all current hunting troubles can be blamed on climate channge:
“The walruses in this July 2012 file photo are hauled out in the Eastern Chukchi Sea. Walrus migration patterns have changed as sea ice and other environmental factors have shifted — and that’s spelled trouble for Alaska Native communities who hunt them for subsistence.”
The people of St. Lawrence Island and the Bering Strait that depend on walrus for subsistence have my sympathy, they indeed have a hard life – but this is not a tale of woe about the status of Pacific walrus and changing summer sea ice.
Bering Strait natives hunt walrus in spring, from mid-April to early June (Huntington et al. 2013). All indications are that walrus are moving differently than they used to in summer because the population is now very large. As far as I know, there is no new population information on walrus that wasn’t available last year, when I covered this topic extensively (Crockford 2014; video below).
Posted onAugust 5, 2015|Comments Off on Long underwater stalk by polar bear shows how hard it is to catch seals in summer
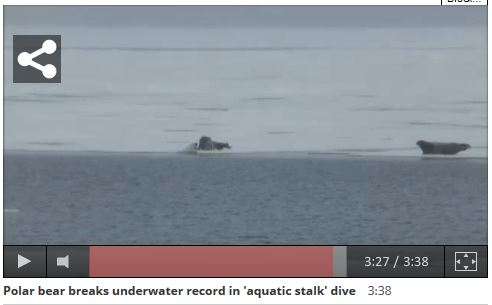
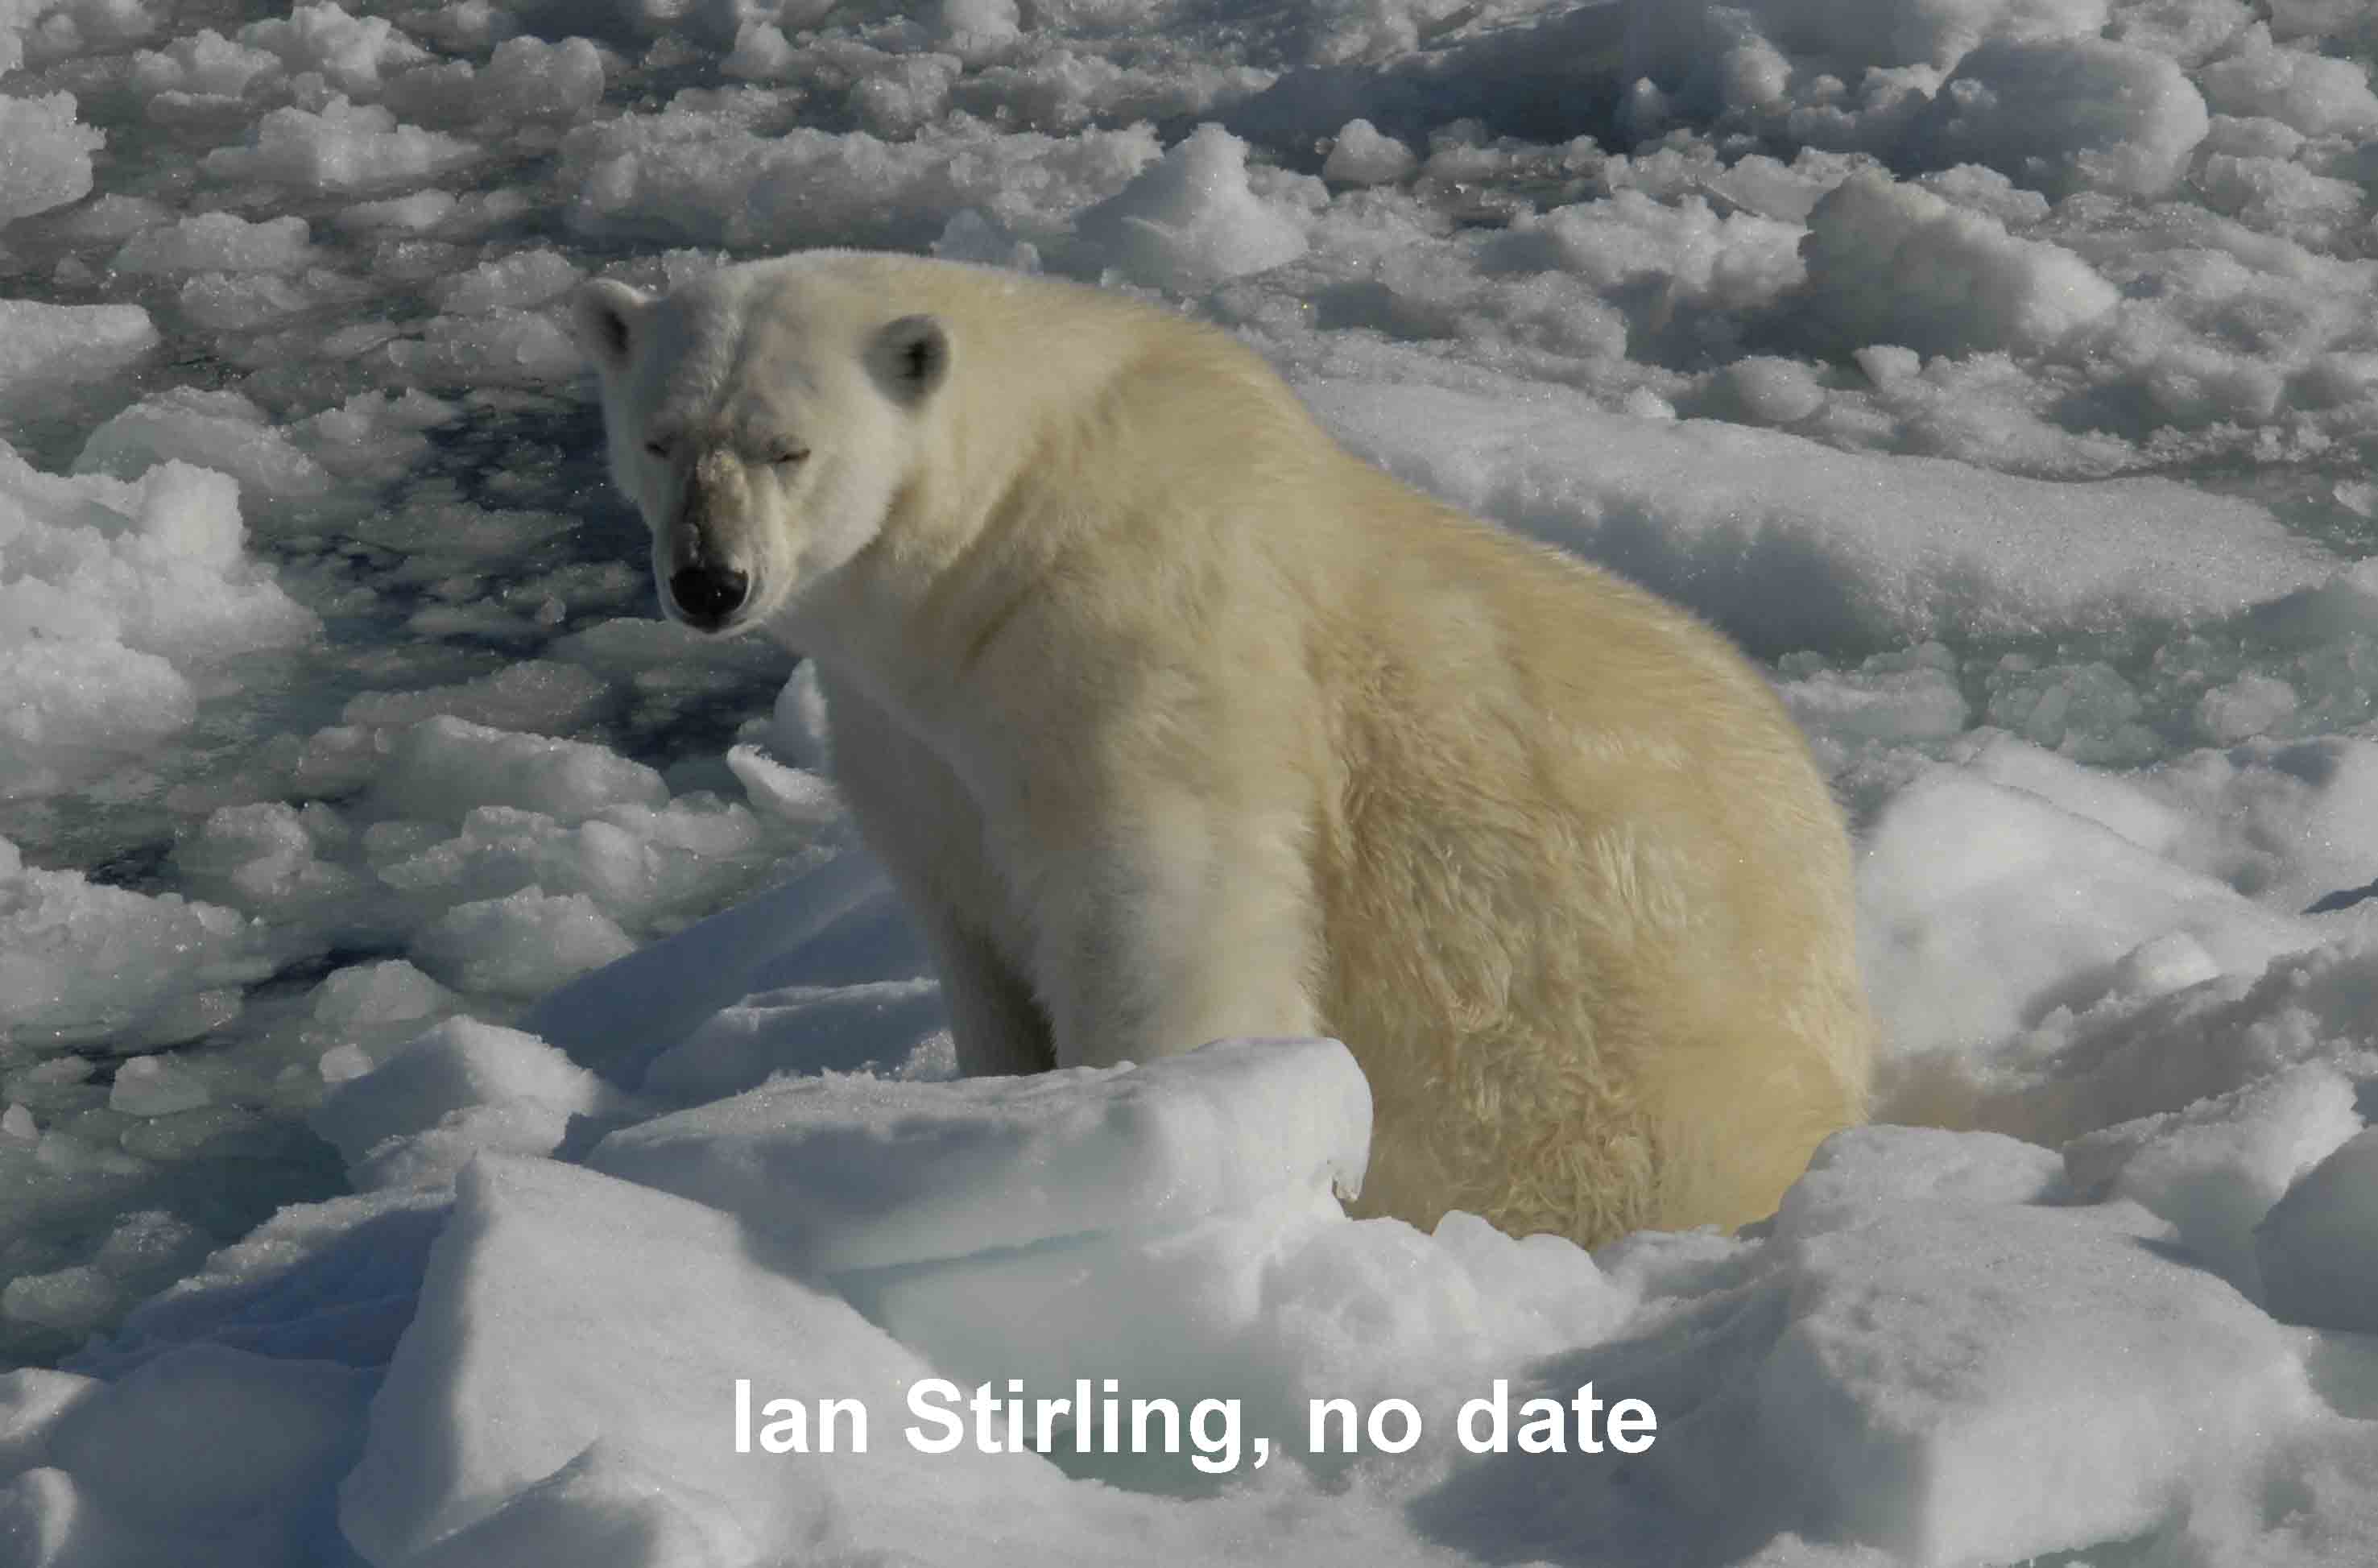
The longest-ever-recorded underwater dive by a polar bear, stalking three bearded seals, shows in striking fashion how truly difficult it is for a polar bear to catch a seal from summer sea ice. After the long dive, the bear (see below screen capture) erupts from the water to try and take the seal resting on the ice but it escapes.
The paper reporting this dive, by Ian Stirling and photographer and Arctic expedition organizer Rinie van Meurs, has hit the news again in a big way, as it finally appeared in print. I wrote about it in June here, when it came out in press. The video was shot on 19 August 2014, at the height of the Arctic summer (July, August, September).
CBC Radio posted the video and interviewed van Meurs yesterday (“As It Happens” 4 August), in which he reportedly made this astonishing statement:
“…after 27 years working, I have seen clearly changes in the sea ice. I don’t need to see the NASA records and graphs and all that.”
Indeed, who needs science and all that? You just have to look out the window of your ship! Anecdotal reports are what count as evidence to people who are not scientists. Van Meurs, who is not a scientist, is who the media gets to interview. Where’s co-author Stirling, the scientist?
More stills from the van Meurs video below – too bad, so sad, the bear gets no seal. Why polar bears eat little in the summer even if they are out on the ice hunting, as I discussed here.
Posted onAugust 4, 2015|Comments Off on July 2015: all 13 collared polar bears in the Southern Beaufort are out on the sea ice
Most of these bears are close enough to shore to hit the beach if that’s where they wanted to be but they’re on the sea ice.
I’ve been posting these USGS tracking maps for two years.1 The map archive at USGS goes back to December 2009. Seeing all animals on the ice in July is usual for Southern Beaufort polar bears.
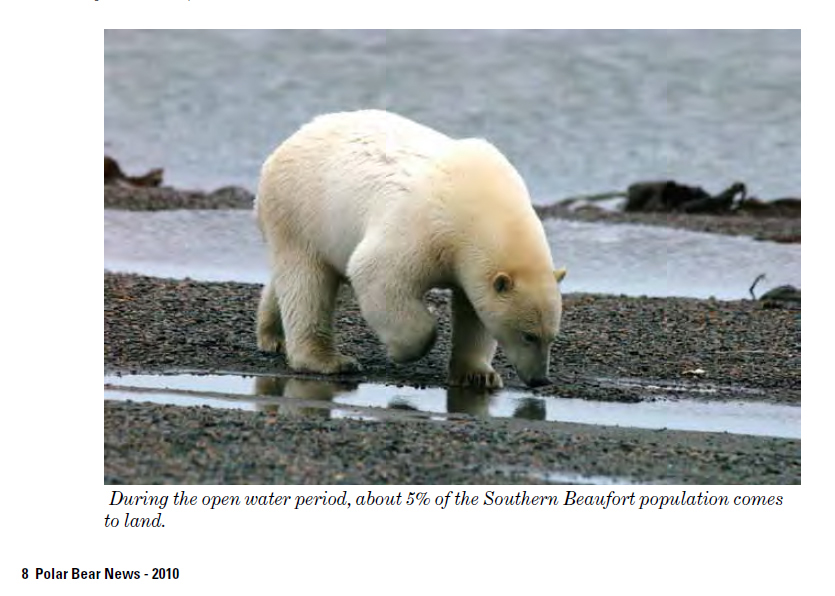
During August, a few of these females usually come ashore (see here and here), probably because they plan to den there later. But most polar bear females stay out on the ice, no matter how far it contracts into the Arctic Basin. Only about 5% of SB bears spend time on land during the summer.
See the July track map below and some sea ice maps and graphs for the region. Continue reading
Comments Off on July 2015: all 13 collared polar bears in the Southern Beaufort are out on the sea ice
Posted onAugust 2, 2015|Comments Off on Keeping track of problem bears in Churchill
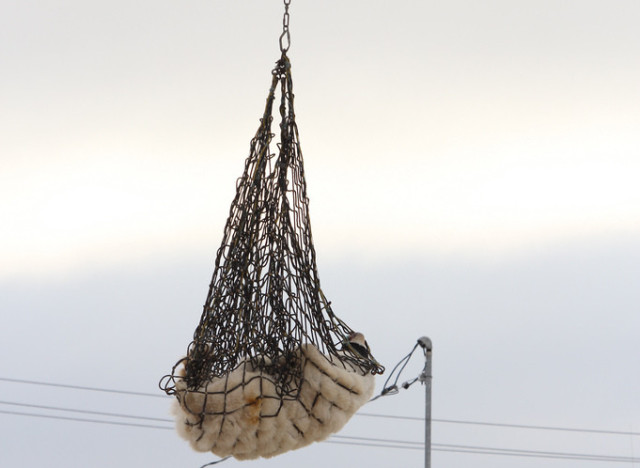
The City of Churchill has recently taken to posting its problem bear reports on its Facebook page. This is something to keep an eye on, so let’s catch up so that future reports can be put into context.
Photo above: A bear is transported to Churchill’s polar bear holding facility (from a 2011 Huffington Post article, “Polar Bear Prison”).
Posted onJuly 29, 2015|Comments Off on Hudson Bay, Davis Strait and Foxe Basin sea ice highest since 1992
We are seeing one of the extremes in Hudson Bay sea ice variability this year, not only in extent but in distribution of ice. Ice coverage on Hudson Bay this year at 28 July was twice what it was in 2009, the last “late” ice breakup year for which detailed ice maps are available (409 vs. 204 thousand km2), according to NSIDC MASIE ice maps. Canadian Ice Service data show 2015 coverage for the week of 30 July was the highest since 1992.
The odd pattern of ice distribution presents a conundrum. Have a look at the maps and graphs below.
Posted onJuly 25, 2015|Comments Off on Researcher says most S. Hudson Bay polar bears still on the ice, may have to swim home
More than half of Southern Hudson Bay polar bears under study are still out on the thick Hudson Bay sea ice that’s been giving Canadian Coast Guard icebreakers so much trouble.
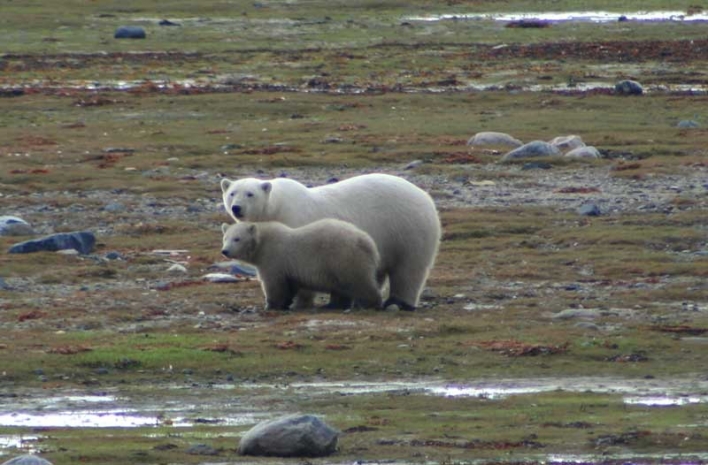
James Bay polar bear female and her cub on shore. Courtesy Ministry of Natural Resources, News Ontario, June 2, 2009.
As I pointed out a few days ago, most of the ice remaining on Hudson Bay is in the region used by Southern Hudson Bay polar bears. While you wouldn’t know it from the Polar Bears International“Bear Tracker” – which hasn’t been updated since 2 July – on Friday (24 July 2015) Ontario polar bear researcher Martyn Obbard used the PBI website to reveal where his study sample of polar bears are located.
Obbard posted a little essay on PBI’s “Save our sea ice!” websitewhich had, buried near the end, the admission that on 20 July, five out of his nine Southern Hudson Bay females with satellite radio collars were still out on the ice, “far from the Ontario coast.” Continue reading
Comments Off on Researcher says most S. Hudson Bay polar bears still on the ice, may have to swim home
Posted onJuly 23, 2015|Comments Off on Polar bear habitat update: Eastern Canada well above normal, lots of sea ice worldwide
Sea ice in at least three Eastern Canadian polar bear subpopulations is well above normal for this time of year, which means many bears are likely not ashore yet. The same is true in the Beaufort and Barents Seas – ice is melting but there is still a fair amount of sea ice close to popular shores. Cause for cheering, not raising alarms.
Southern Hudson Bay, Foxe Basin, and Davis Strait, all have above average sea ice coverage, according to the Canadian Ice Service (see charts below).
Sea ice concentration in Canadian waters at 23 July 2015. Canadian Ice Service. Click to enlarge.
Hudson Bay ice levels are particularly striking: the anomaly map below (“departure from normal”) is almost entirely blue (positive), showing how far it is above average. No wonder supply ships needed icebreaker help yesterday to get into Inukjuak on the eastern shore. Most of the ice is technically in the Southern Hudson Bay polar bear subpopulation region, which has a stable population.
Watch polar bear habitat reform in the Canadian Arctic: “last 10 days” Canadian Ice Service animation (works anytime) HERE.
See Quote archive for details.


You must be logged in to post a comment.