
The most recent issue of Arctic Sea Ice News provided by the National Snow and Ice Data Center (NSIDC) – the official US keeper of sea ice data – (July 17, 2013) included an interesting graph of sea ice extent in the Chukchi and Beaufort Seas at July 12.
They present the data for 2007 to 2013, compared to the new 30 year average1, and note that the Beaufort Sea had “the most extensive ice cover seen there in the last seven summers.” It is also clear from their graph that the 2013 extent was virtually identical to the average in both regions (Fig. 1).

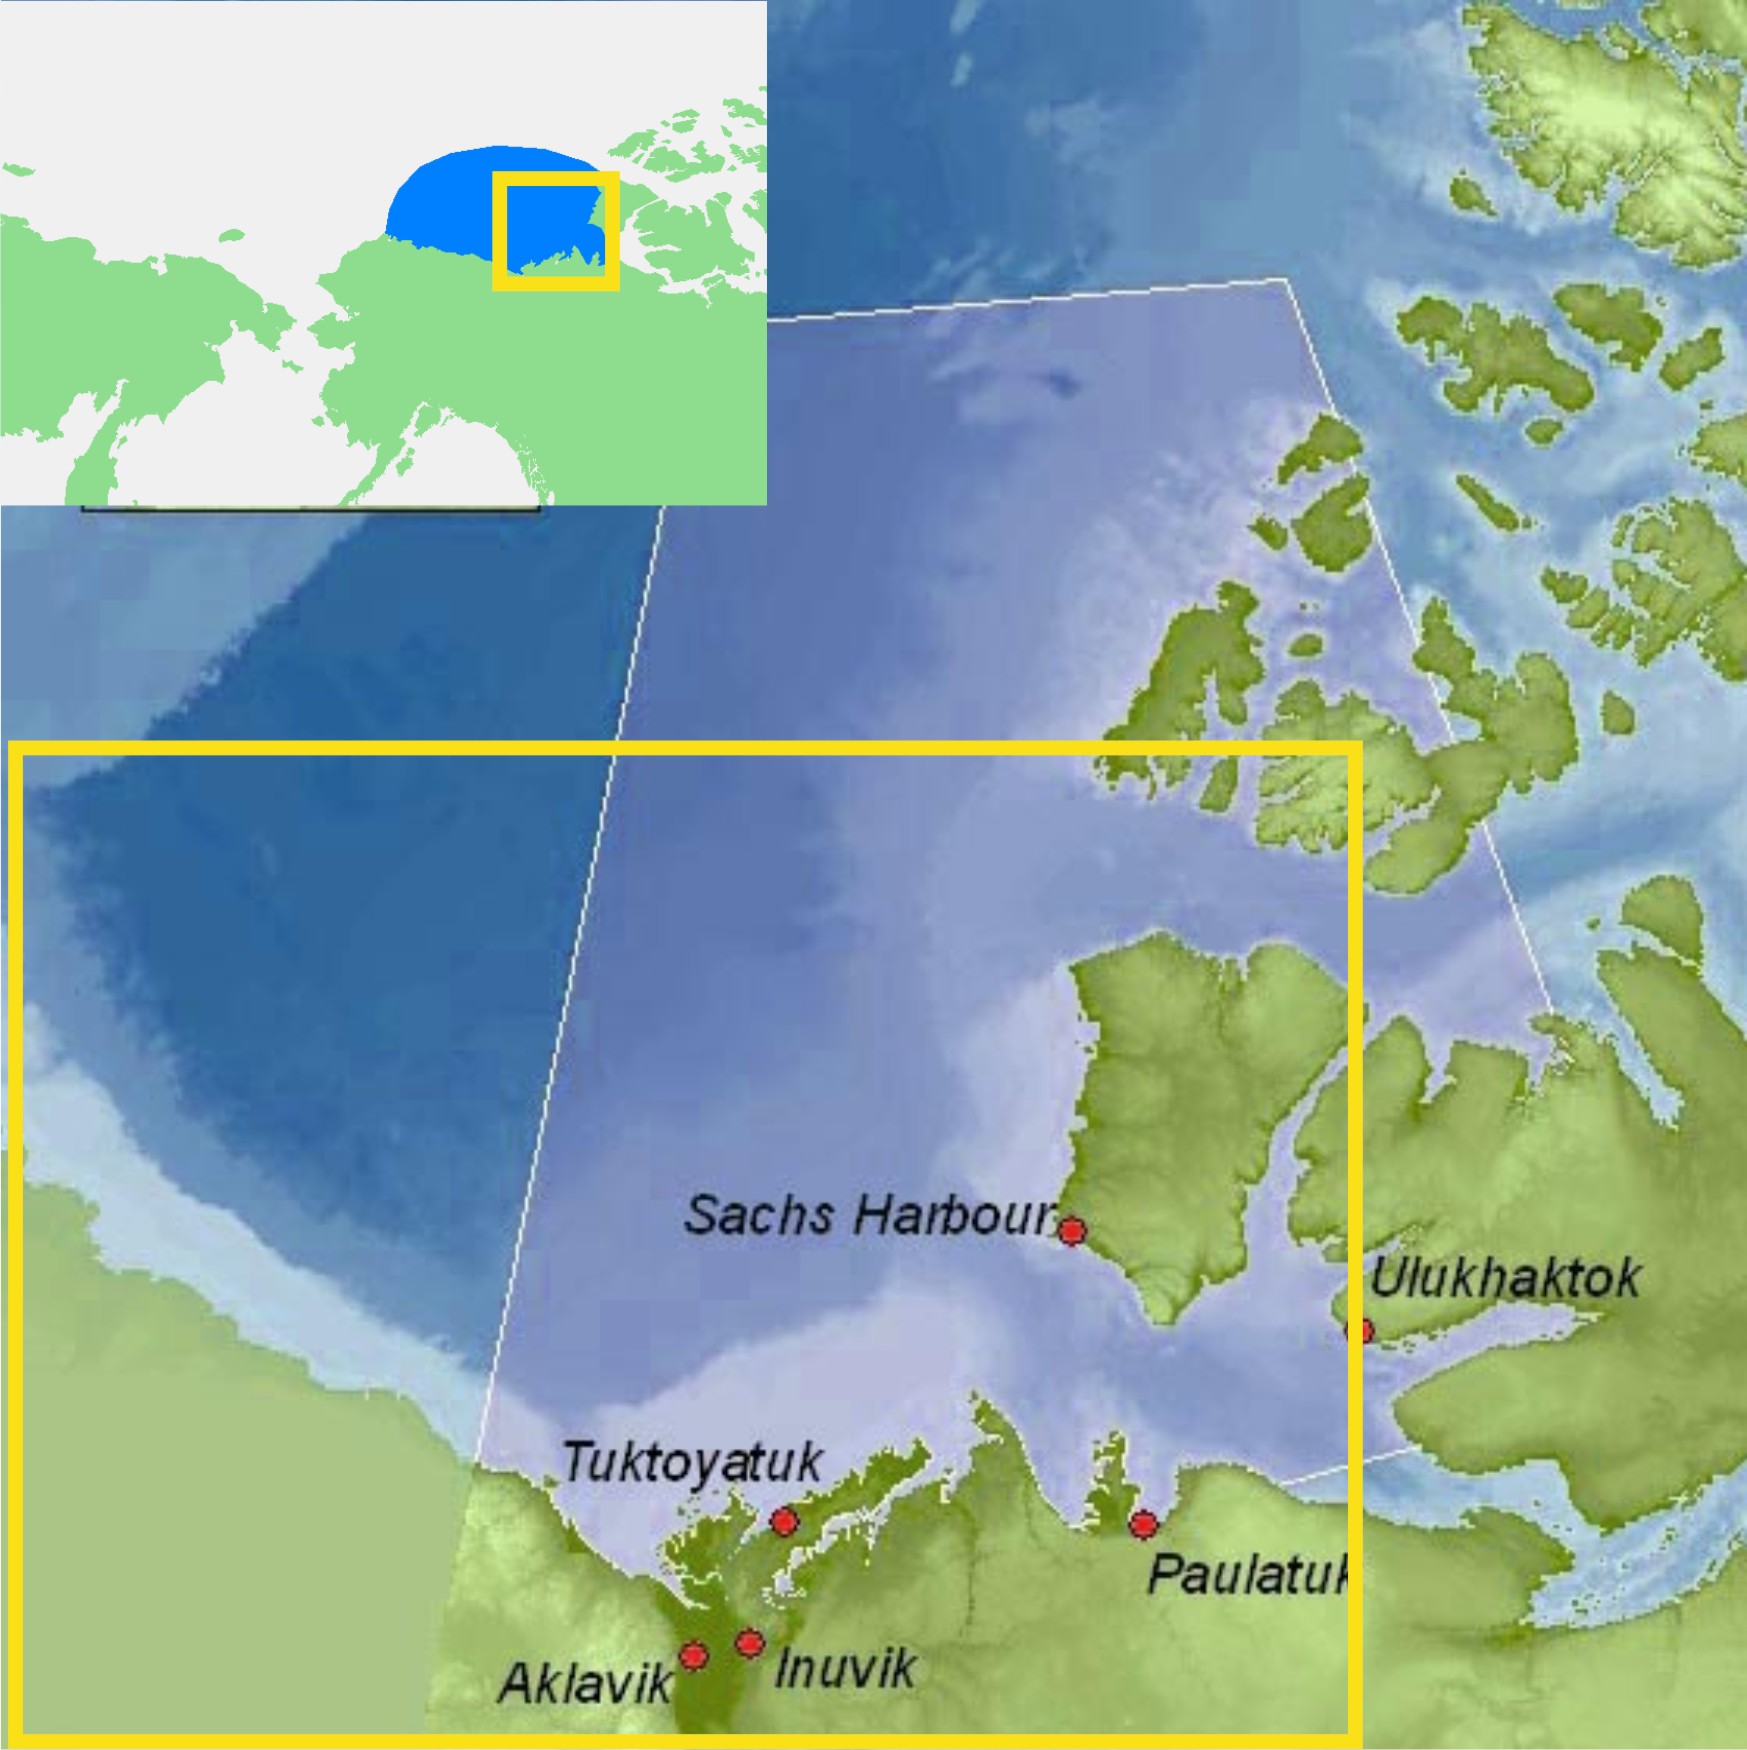
Figure 1. Graph of sea ice extent at July 12 each year from 2007 to 2013 from the National Snow and Ice Data Center, NSIDC. “Climatology” (last set of bars) is the 30 year average (1981-2010) extent at this date.1 It is clear from the graph that the 2013 extent was virtually identical to the 30-year average. Map from Wikipedia.
What puzzled me was why they featured only the last 7 years when satellite data go back to at least 1979. Is there something in that data they don’t want us to see?
There is no similar data in graph form available that I could find but there is the wonderful comparative sea ice mapping tool provided by Cryosphere Today, operated by the University of Illinois.
So, in the absence of numerical data to compare to the Fig. 1 graph, I chose visual data to ask the question: what could there be about the long-term record of Chukchi/Beaufort sea ice data that the NSIDC might not want us to know?
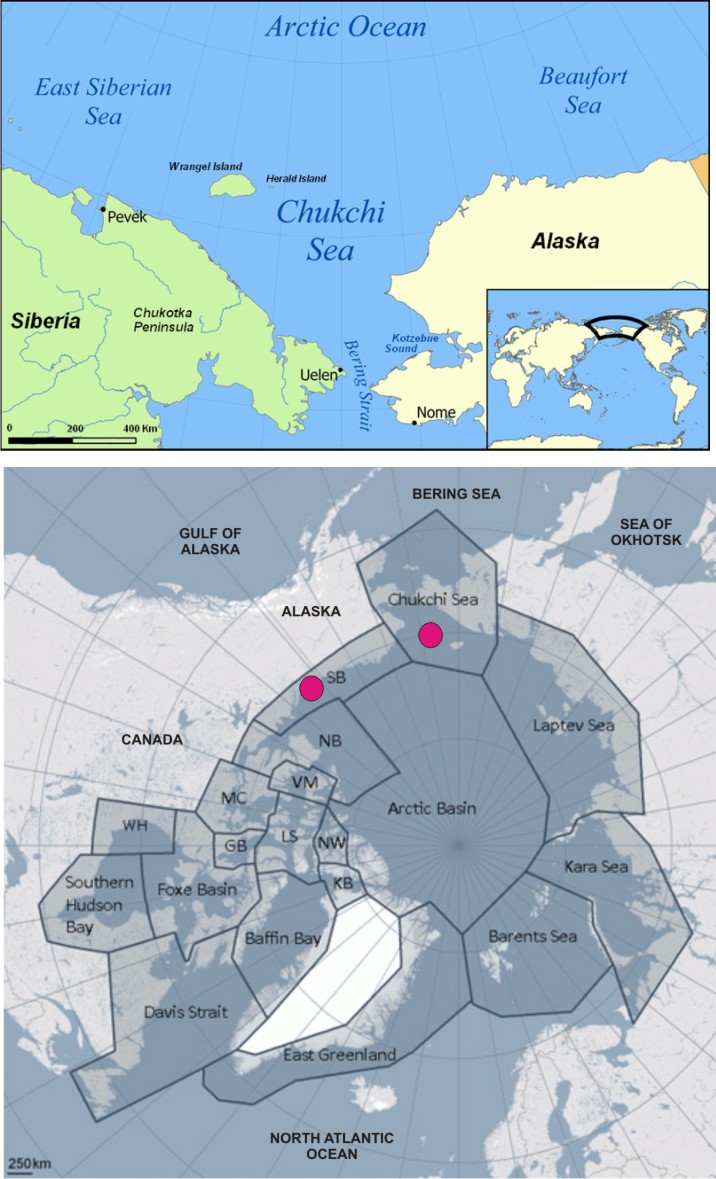
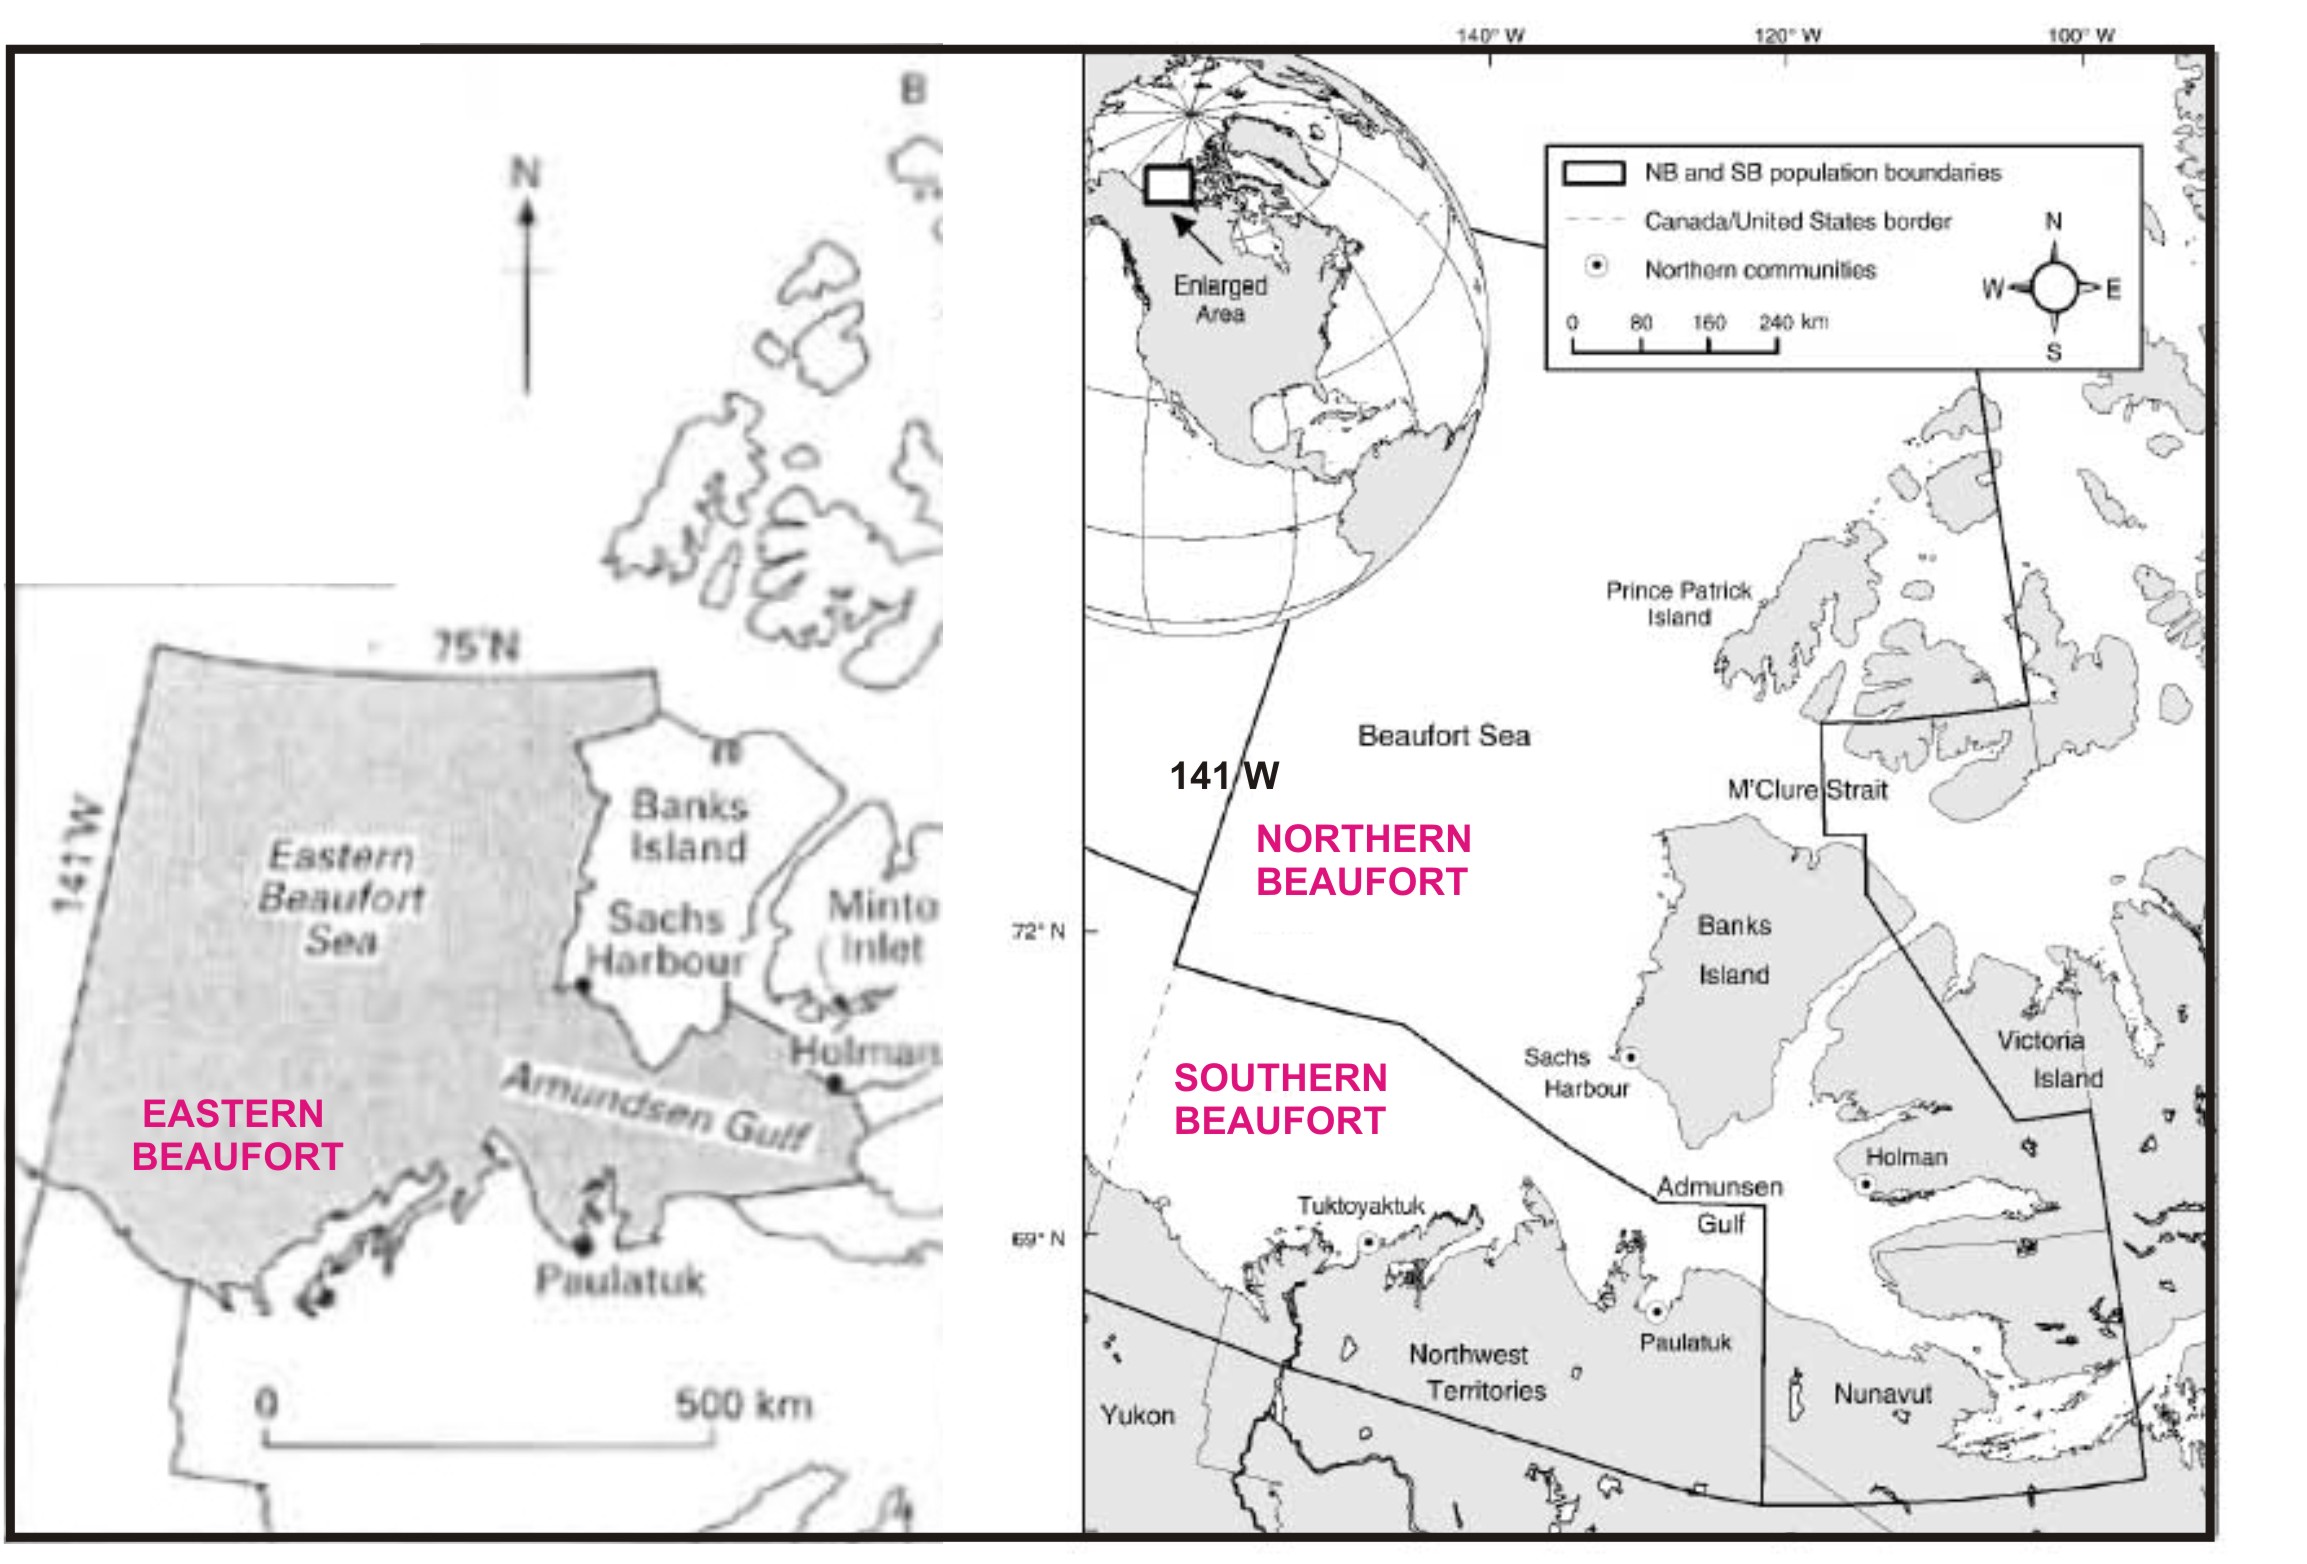
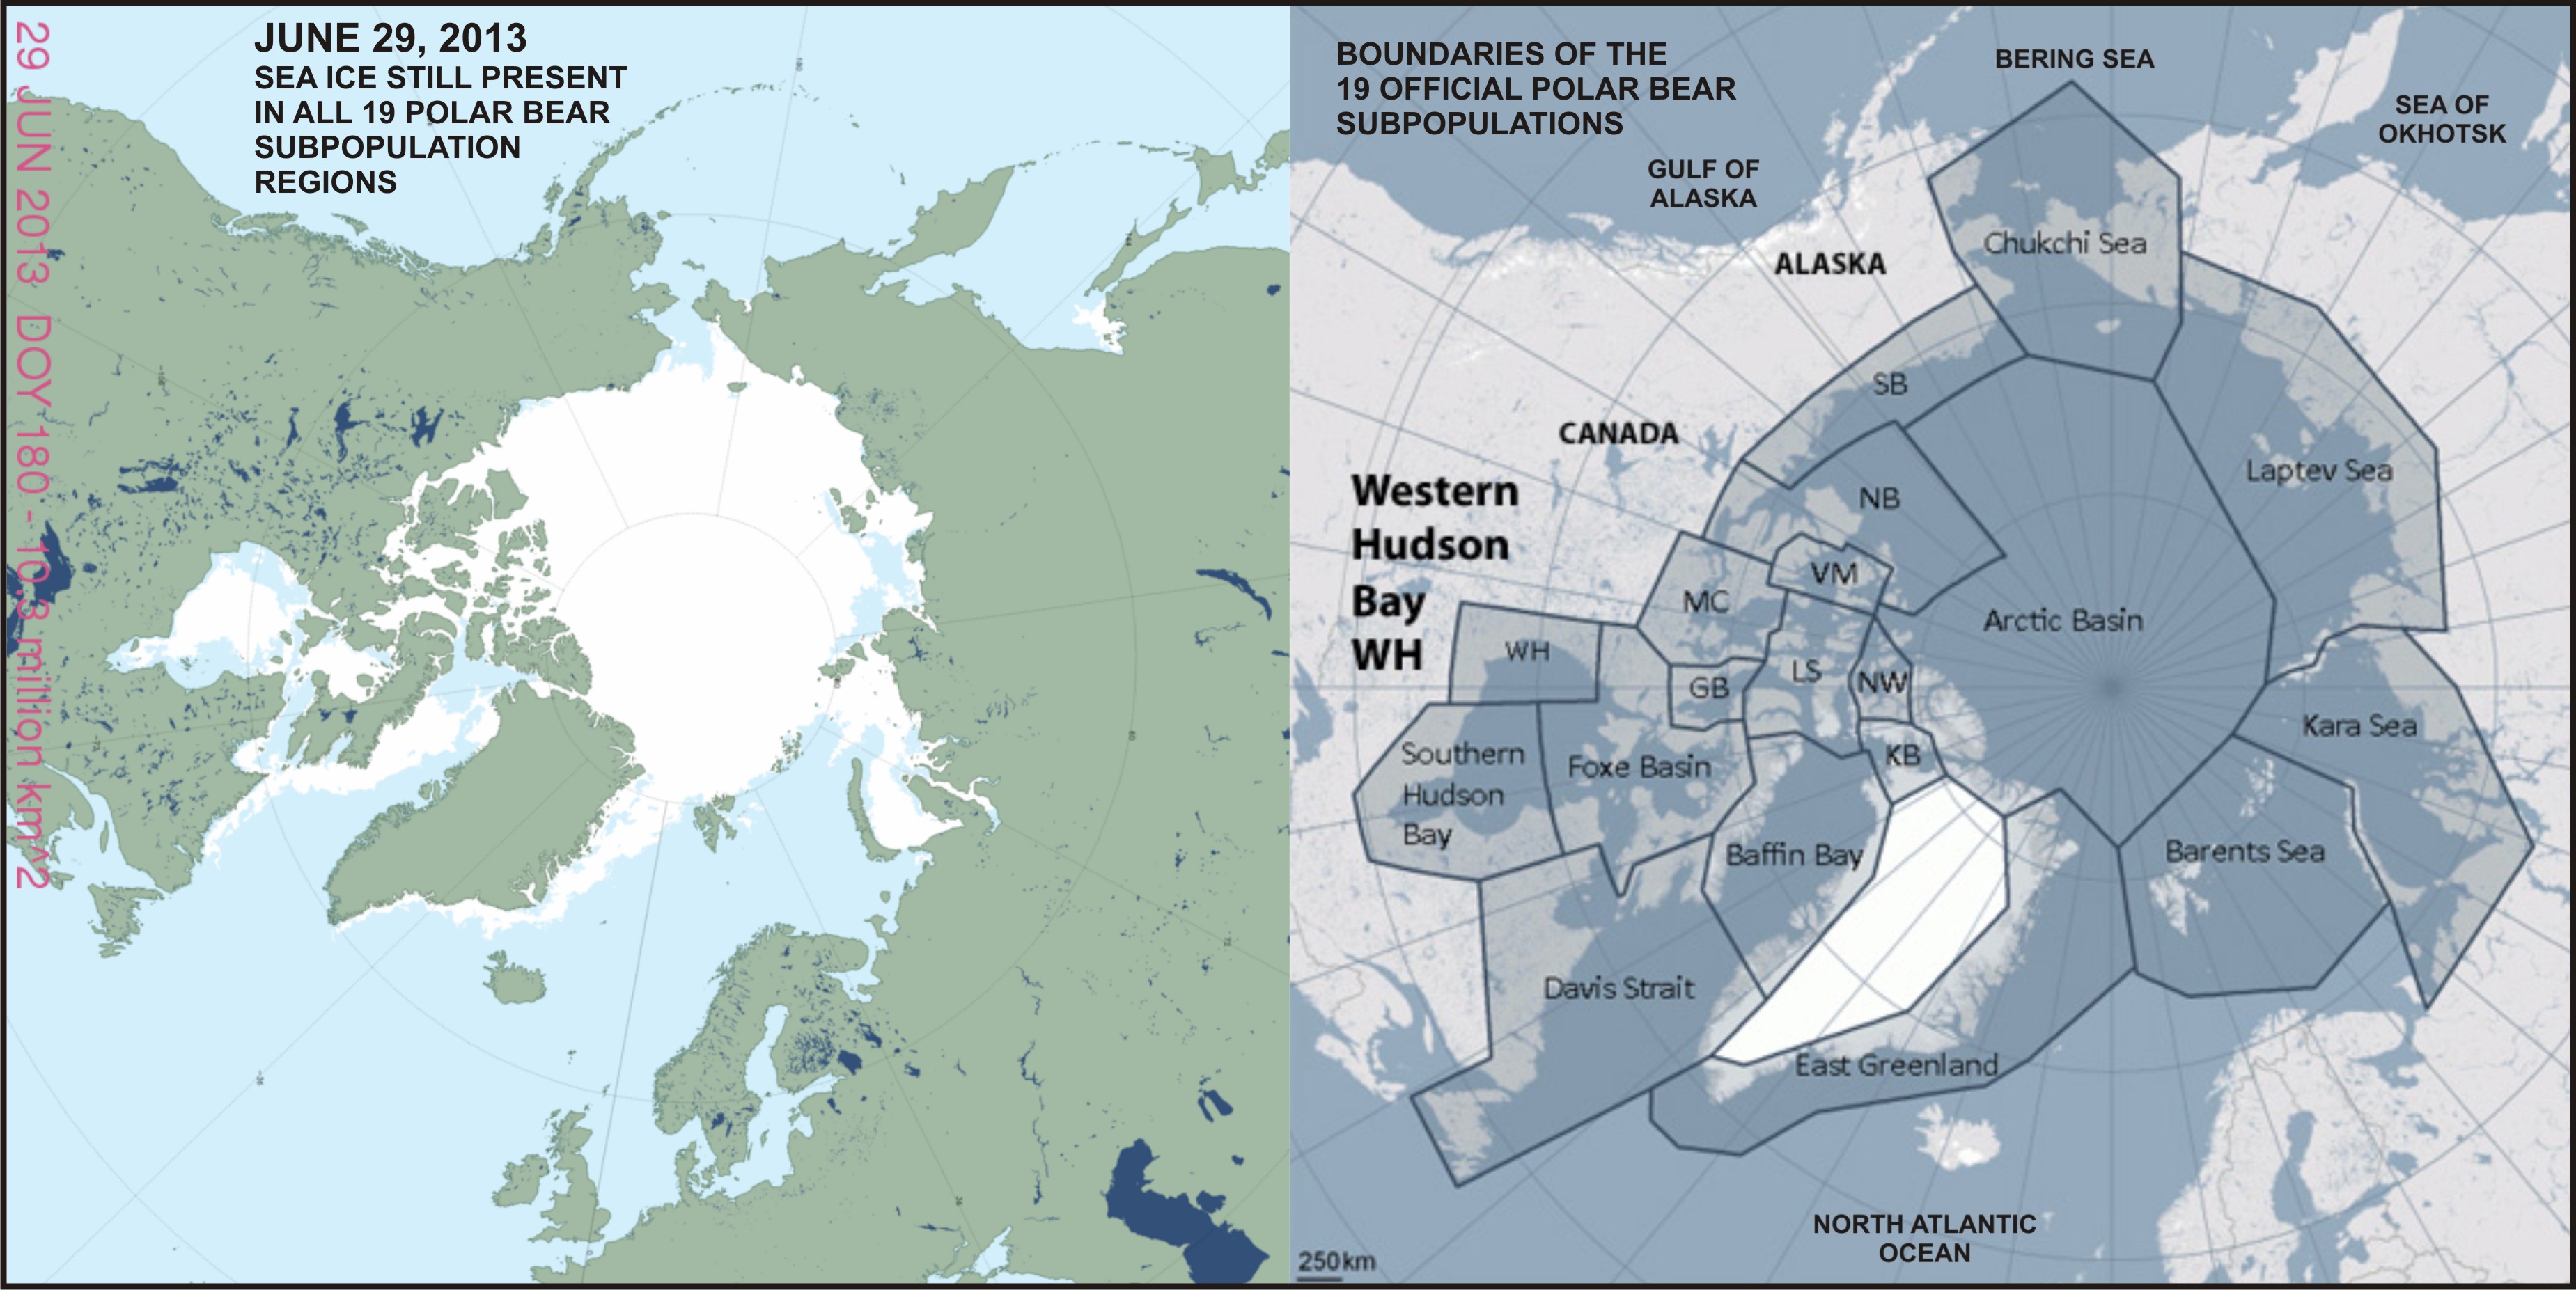
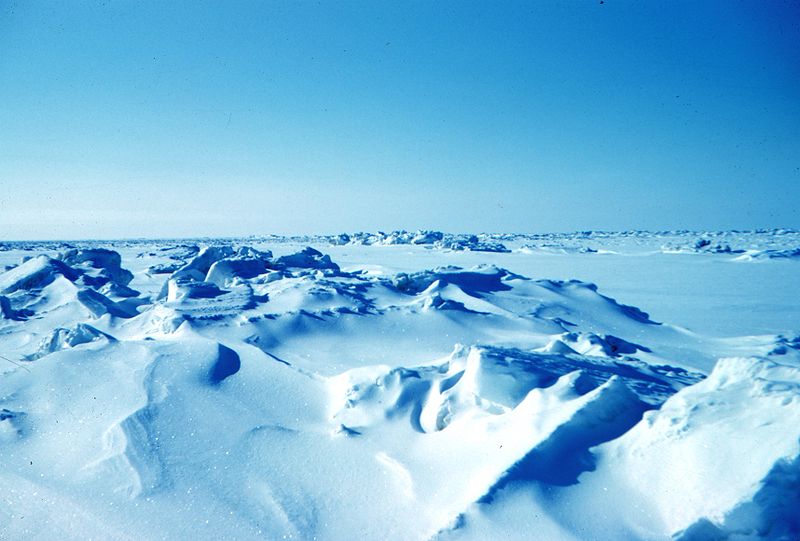
The ice coverage at mid-summer (July 12) provides a snapshot of what sea ice conditions are like for polar bears before the summer melt season gets into full swing, so this historical perspective is quite revealing. [See previous posts here, here, and here for more on Chukchi/Beaufort polar bears.]
Continue reading


You must be logged in to post a comment.